
Fig. 2
- ID
- ZDB-FIG-180117-25
- Publication
- Buckley et al., 2017 - Precise spatio-temporal control of rapid optogenetic cell ablation with mem-KillerRed in Zebrafish
- Other Figures
- All Figure Page
- Back to All Figure Page
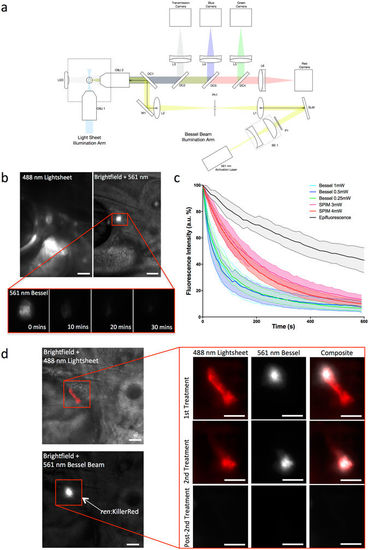
Introduction of a Bessel beam into the imaging path of the SPIM set up allows rapid, localised targeting of KillerRed-expressing cells in vivo. (a) Schematic diagram of the imaging path of the SPIM system, for fluorescence imaging, with the integrated Bessel beam for cell targeting. OBJ1, OBJ2 are objective lenses; LED, light emitting diode; DC1, DC2, DC3, DC4, dichroic mirrors; L1, L2, L3, L4, L5, L6, lenses; SLM, spatial light modulator; BE1, beam expander; P1, polarizer; Ph1, pin hole; M1, mirror. Coloured lines shown in light blue, blue, green, red, grey and yellow represent light paths for the incident SPIM light-sheet, excited blue fluorescence, excited green fluorescence, excited red fluorescence, imaged transmission light and incident Bessel beam illumination, respectively. (b) KillerRed cells in 3 dpf ren:mem-KillerRed larvae (indicated by the red box) were located using low power, low frame-rate 488 nm light-sheet excitation (top left panel). The 561 nm Bessel beam was translated to the correct position and superimposed with brightfield illumination for a single frame (top right panel). Brightfield illumination was then turned off and a fluorescence emission image acquired every 10 s using the Bessel illumination until the fluorescence intensity had decreased to the background level approximately 10 min later (representative images shown in bottom panel). (c) Graphs showing the fluorescence intensity as a percentage of the maximum intensity (arbitrary fluorescence units, a.u.), plotted against time and averaged (with 95% confidence intervals, indicated by the filled dashed lines). Cells were targeted using the Bessel beam with incident powers of 1 mW, 0.5 mW or 0.25 mW (as measured at the back aperture of OBJ2). The fluorescence intensity measured from acquired images and represented as a percentage of the maximum value, averaged over between n = 10 and n = 12 fish. This is represented individually for each power, and as a comparison between the three different targeting methods: epifluorescence illumination, SPIM light sheet illumination and Bessel beam illumination. Data has been truncated at 600 s to clearly show the initial rapid decay when using Bessel illumination. (d) SPIM image showing subsets of KillerRed-expressing cells, which were targeted using the Bessel beam. A representative example is given where the correct location of cells was confirmed using the 488 nm light-sheet, and the 561 nm Bessel beam translated to the dorsal end of the AMA. Relative location within the fish is demonstrated by co-localising fluorescence signal with a brightfield image. Light treatment was performed, targeting a subset of cells (shown before 1st Treatment in the top panel) along the AMA and the decrease in fluorescence intensity confirmed using the light-sheet (shown before 2nd Treatment in the second panel). The remaining cells, which showed no decrease in fluorescence intensity after the first treatment, were then targeted for a second treatment. No evidence of KillerRed expression remained after the second light treatment (shown in the bottom Post-2nd Treatment panel). All scale bars represent 30 μm. |