
FIGURE
Fig. 1
- ID
- ZDB-FIG-180104-26
- Publication
- Rauwerda et al., 2017 - Transcriptome dynamics in early zebrafish embryogenesis determined by high-resolution time course analysis of 180 successive, individual zebrafish embryos
- Other Figures
- All Figure Page
- Back to All Figure Page
Fig. 1
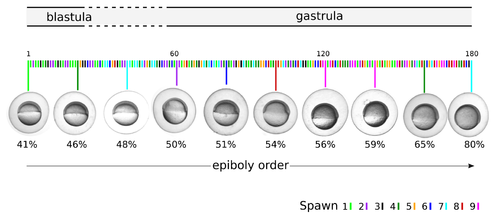
Individual transcriptomes were established of 180 embryos from 9 different spawns (parents) in a developmental stage ranging from late blastula to mid gastrula (approximately 5 to 8 h post fertilization, hpf). The developmental stage was samples with an average of one embryo per minute. Each embryo was photographed and several metrics were recorded (Additional file 1). Here ten embryos are shown with increasing epiboly from left to right |
Expression Data
Expression Detail
Antibody Labeling
Phenotype Data
Phenotype Detail
Acknowledgments
This image is the copyrighted work of the attributed author or publisher, and
ZFIN has permission only to display this image to its users.
Additional permissions should be obtained from the applicable author or publisher of the image.
Full text @ BMC Genomics