Fig. 11
- ID
- ZDB-FIG-171228-28
- Publication
- England et al., 2017 - Identification and Expression Analysis of the Complete Family of Zebrafish pkd Genes.
- Other Figures
- All Figure Page
- Back to All Figure Page
|
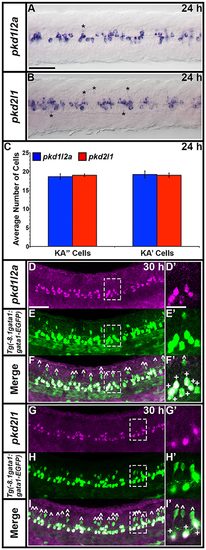
pkd1l2a and pkd2l1 are co-expressed in zebrafish KA cells. Dorsal view of pkd1l2a (A) and pkd2l1 (B) expression in 24 h spinal cord. Rostral left. Most of the labeled cells are KA cells that abut the central canal. Asterisks indicate expression in occasional weak, more lateral cells (that correspond to the more dorsal cells indicated in Figures 8G–R). Prolonged staining sometimes reveals additional weak, lateral cells (data not shown). (C) Average number of cells (y-axis) expressing pkd1l2a (blue) and pkd2l1 (red) in KA″ and KA′ cells (x-axis) at 24 h in WT spinal cord region adjacent to somites 6–10 (n = 5). Error bars indicate standard error of the mean. There is no statistical difference between the number of pkd1l2a and pkd2l1-expressing KA″ (p = 0.6419) and KA′ (p = 0.8571) cells respectively (Student's t-test). These data do not include occasional non-KA lateral cells (2 cells each in 2/5 pkd2l1-labeled embryos; 0 cells in 5 pkd1l2a-labeled embryos). (D–F',G–I') Lateral views of zebrafish spinal cord at 30 h. Anterior left, dorsal top. In situ hybridization (purple) for pkd1l2a (D,D') and pkd2l1 (G,G'), EGFP immunohistochemistry (green) in Tg(–8.1gata1:gata1-EGFP) embryos (E,E',H,H') and merged views (F,F',I,I'). (D'–I') Magnified single confocal plane of white dotted box region. 100% of pkd1l2a and pkd2l1-expressing KA cells co-express Tg(–8.1gata1:gata1-EGFP) and 100% of GFP-positive Tg(–8.1gata1:gata1-EGFP) KA cells co-express either pkd1l2a (F, indicated with + in F') or pkd2l1 (I, indicated with + in I'). No GFP-positive Tg(–8.1gata1:gata1-EGFP) dorsal V2b cells co-express either pkd1l2a (white ˆ in F,F') or pkd2l1 (white ˆ in I,I'). Double-labeled cells are not indicated in (D–I) main panels as they are so numerous. Scale bar (A) = 50 μm (A,B). Scale bar (D) = 50 μm (D–I) and 20 μm (D'–I'). |
| Genes: | |
|---|---|
| Fish: | |
| Anatomical Terms: | |
| Stage Range: | Prim-5 to Prim-15 |

