
FIGURE
Fig. 7
- ID
- ZDB-FIG-171127-5
- Publication
- Kozawa et al., 2016 - Real-time prediction of cell division timing in developing zebrafish embryo
- Other Figures
- All Figure Page
- Back to All Figure Page
Fig. 7
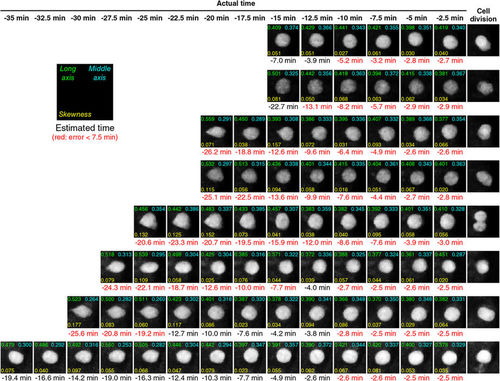
Real-time prediction of division-timing of individual V2 cells. A total of eight individual V2 cells were subjected to the real-time prediction system shown in Fig. 6 (see also “Real-time prediction of cell-division timing” section of Methods) and the results of the predictions are shown for each time-point. Long axis (i.e., |
 ), Middle axis (i.e.,
  ), Skewness (i.e., A) values are indicated at the top left, top right, bottom left, in each panel, respectively. The predicted times in red-color at the bottom of each image panel are those within 7.5 min (equivalent to three time-steps) accuracy. Scale bar, 10 μm.
Expression Data
Expression Detail
Antibody Labeling
Phenotype Data
Phenotype Detail
Acknowledgments
This image is the copyrighted work of the attributed author or publisher, and
ZFIN has permission only to display this image to its users.
Additional permissions should be obtained from the applicable author or publisher of the image.
Full text @ Sci. Rep.