
Fig. 2
- ID
- ZDB-FIG-171127-25
- Publication
- Ota et al., 2016 - Functional visualization and disruption of targeted genes using CRISPR/Cas9-mediated eGFP reporter integration in zebrafish
- Other Figures
- All Figure Page
- Back to All Figure Page
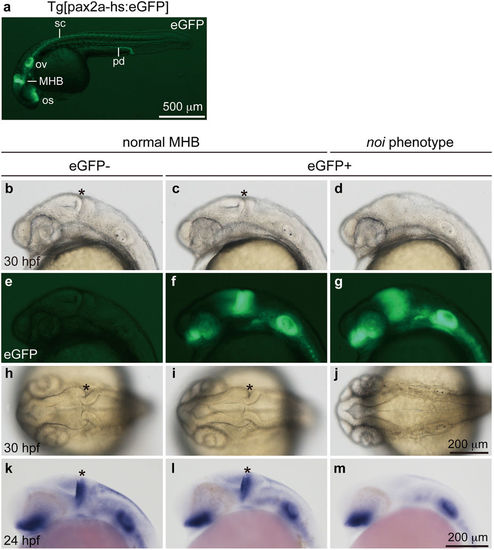
eGFP expression and noi phenotype in Tg[pax2a-hs:eGFP] embryos. (a) A heterozygous Tg[pax2a-hs:eGFP] embryo at 30 hpf. The expression of eGFP was detected in the MHB, the optic stalk (os), the otic vesicles (ov), the spinal cord (sc) neurons and the pronephric duct (pd). (b–j) The 30 hpf F2 embryos derived from mating of heterozygous Tg[pax2a-hs:eGFP] F1 fish. (b,e,h) A wild-type embryo. The isthmus is formed at the MHB (asterisk). (c,f,i) A heterozygous Tg[pax2a-hs:eGFP] embryo. The isthmus is formed normally. (d,g,j) A homozygous Tg[pax2a-hs:eGFP] embryo. eGFP expression around the MHB was anteriorly expanded. The isthmus was not formed in the homozygous Tg[pax2a-hs:eGFP] embryo. Genotyping was performed using genomic PCR. (k–m) Whole-mount in situ hybridization using anti-sense pax2a RNA probe at 24 hpf. The pax2a expression in the MHB was detected in the wild-type (k) and the heterozygous (l) embryos, but not in the homozygous embryos (m). (a–g,k–m) Lateral view with anterior to the left and dorsal to the top. (h–j) Dorsal view with anterior to the left. |
| Genes: | |
|---|---|
| Fish: | |
| Anatomical Terms: | |
| Stage Range: | Prim-5 to Prim-15 |
| Fish: | |
|---|---|
| Observed In: | |
| Stage Range: | Prim-5 to Prim-15 |