
FIGURE
Fig. 4
- ID
- ZDB-FIG-171108-10
- Publication
- Du et al., 2016 - TPhP exposure disturbs carbohydrate metabolism, lipid metabolism, and the DNA damage repair system in zebrafish liver
- Other Figures
- All Figure Page
- Back to All Figure Page
Fig. 4
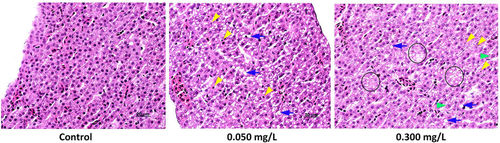
Representative micrographs of liver sections from zebrafish (n = 10) exposed to the indicated experimental concentrations of TPhP for 7 days. Blue arrows indicate vacuolization, yellow arrowheads indicate pyknotic nucleus, green arrowheads indicate karyorrhexis, and areas in black ellipses indicate cells losing nuclei. |
Expression Data
Expression Detail
Antibody Labeling
Phenotype Data
Phenotype Detail
Acknowledgments
This image is the copyrighted work of the attributed author or publisher, and
ZFIN has permission only to display this image to its users.
Additional permissions should be obtained from the applicable author or publisher of the image.
Full text @ Sci. Rep.