
Fig. 3
- ID
- ZDB-FIG-171106-7
- Publication
- Shu et al., 2016 - The basal function of teleost prolactin as a key regulator on ion uptake identified with zebrafish knockout models
- Other Figures
- All Figure Page
- Back to All Figure Page
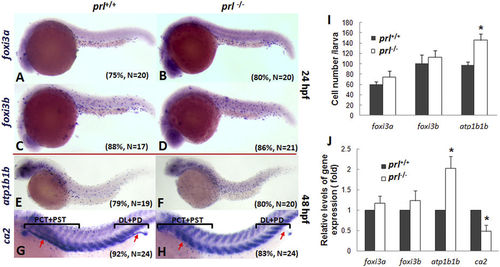
Expression patterns of ionocyte progenitor markers. (A–H) Expression patterns of foxi3a (A,B) forkhead box I3a, an early marker for HR cells) and foxi3b (C,D) forkhead box I3b, an early marker for NaR cells) in wild-type (left) and prl-deficient (right) larvae at 24 hpf and ca2 (E,F) carbonic anhydrase II, a marker for HR cells) and atp1b1b (G,H) ATPase, Na+/K+ transporting, beta 1b polypeptide, a marker for NaR cells) in wild-type (left) and prl-deficient (right) larvae at 48 hpf. (I) counts of foxi3a, foxi3b and atp1b1b expression cells based on in situ results. (J) Expression levels of foxi3a and foxi3b (at 24 hpf), ca2 and atp1b1b (at 48 hpf) in total tissue from wild-type and prl-deficient larvae in regular zebrafish egg water via qRT-PCR assay. *significant difference (P < 0.05). Arrows, pronephric ducts; The qRT-PCR result shown here is the representative of the results obtained in two separate experiments. For in situ hybridization results, at least 17 embryos/genotype were analyzed in two separated experiments. For cell counts, 8 embryos were analyzed in two groups (N = 8). |
| Genes: | |
|---|---|
| Fish: | |
| Anatomical Terms: | |
| Stage Range: | Prim-5 to Long-pec |
| Fish: | |
|---|---|
| Observed In: | |
| Stage: | Long-pec |