
Fig. 2
- ID
- ZDB-FIG-171027-36
- Publication
- Wanner et al., 2016 - 3-dimensional electron microscopic imaging of the zebrafish olfactory bulb and dense reconstruction of neurons
- Other Figures
- All Figure Page
- Back to All Figure Page
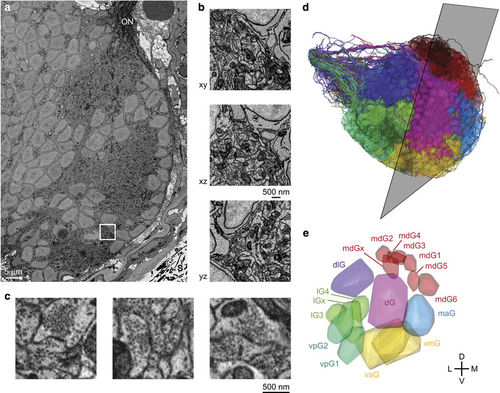
SBEM. (a) EM image showing cross-section through the OB. ON, olfactory nerve; S, silver particles. (b) Reslices through a subvolume. (c) Examples of synapses. (d) Orientation of image plane in (a) is illustrated relative to the reconstruction of all 1,022 neurons in the OB (Dataset 2). Colors depict the group of the parent glomerulus (longest neurite length). (e) 3D outlines of the 17 glomeruli in the OB (Dataset 3). Colors depict different groups of glomeruli as defined by Braubach and colleagues47,48. 3D rendering in (d,e) was done in PyKNOSSOS. Parts of this figure have been modified from illustrations in a previous publication26. |