
Fig. 4
- ID
- ZDB-FIG-171027-27
- Publication
- Jing et al., 2015 - A feedback regulatory loop involving p53/miR-200 and growth hormone endocrine axis controls embryo size of zebrafish
- Other Figures
- All Figure Page
- Back to All Figure Page
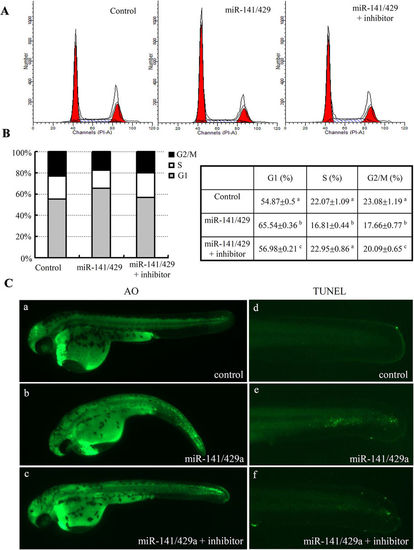
Analysis of cell proliferation and apoptosis phenotypes in zebrafish embryo with miR-200s overexpression. (A) Representative images of FACS analysis of DNA content in 48 hpf zebrafish embryo following injection with miRNA mimics and their inhibitors. (B) Graphical and tabular data for the percentage of cells population at G1, S, G2/M stages. Tukey’s test was used to compare the mean values among the experiment groups. Different letter indicated statistical significance. (C) The cell death phenotypes in whole embryos were revealed by AO staining (a–c) and apoptosis phenotypes in the tails were revealed by TUNEL assays (d–f), respectively. |