
Fig. 2
- ID
- ZDB-FIG-171020-14
- Publication
- Lam et al., 2017 - A high-conductance chemo-optogenetic system based on the vertebrate channel Trpa1b
- Other Figures
- All Figure Page
- Back to All Figure Page
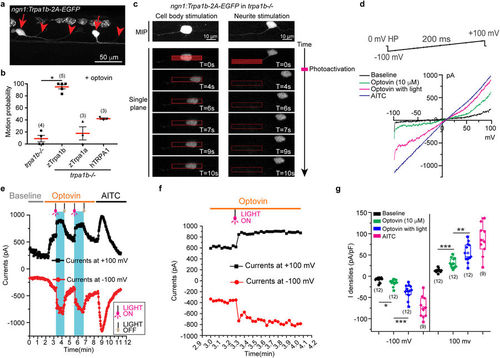
Exogenous expression of zTrpa1b in sensory neuron of trpa1b−/− mutants and sub-cellular photo-activation. (a) Maximum intensity projection showing mosaic expression of zTrpa1b in Rohon-Beard neurons in the trunk of a zebrafish larva at 2.5 dpf. Red arrows and arrowheads indicate the Rohon-Beard neuronal cell body and its neurite projection, respectively. (b) Photomotor response was tested in trpa1b mutant (trpa1b−/−) controls, or in trpa1b mutants expressing zebrafish Trpa1b (zTrpa1b), zebrafish Trpa1a (zTrpa1a) or human TRPA1 (hTRPA1) in Rohon-Beard neurons (Video S1), pretreated with 10 µM optovin. Values are means ± SEM from more than 3 experiments. Each experiment has n > 10 per condition. *p < 0.05. (c) Subcellular photo-activation of a zTrpa1b expressing Rohon-Beard neuron in a trpa1b mutant. MIP, confocal maximum intensity projection. Representative single plane time series images with photo-activation targeting neuron cell body (n = 10) (left panel; Video S2) or neurite (n = 9) (right panel; Video S3) in the trunk region of a zebrafish larvae in vivo. Red rectangular box indicates the time and location where photo-activation was made. (d) Current-Voltage relationships of zTrpa1b currents without treatment (black), 10 μM Optovin alone (green), 10 μM Optovin and light (magenta) and AITC (blue) (e) Peak whole cell zTrpa1b currents measured at −100 mV (black trace) and +100 mV (red trace); Optovin-dependent photocurrents are highlighted in blue boxes, bounded by light switch-on (magenta bulb) and light switch-off (gray bulb). (f) Data from (e) with higher time resolution. (g) Box chart showing peak current densities of zTrpa1b in indicated conditions at −100 mV and +100 mV (n = />9, error bars represent SEM). |