
Fig. 4
- ID
- ZDB-FIG-171016-24
- Publication
- Ciarlo et al., 2017 - A chemical screen in zebrafish embryonic cells establishes that Akt activation is required for neural crest development
- Other Figures
- All Figure Page
- Back to All Figure Page
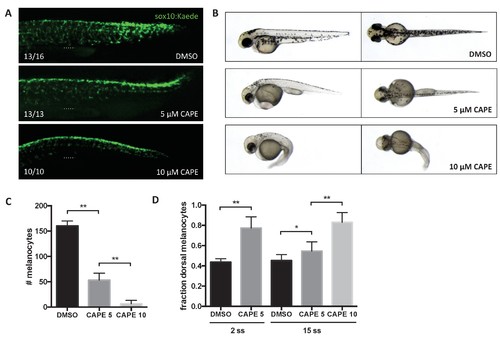
CAPE inhibits neural crest migration and pigment cell differentiation. Embryos were treated at 2 ss unless otherwise indicated. (A) Sox10:Kaede+ cells in the trunk of zebrafish embryos are more dorsally located at 24 hpf. Dotted line indicates top of yolk sac extension. CAPE-treated embryos were allowed to develop for 4 hr longer than control embryos for stage matching. Numbers indicate fraction of embryos for which images are representative. Some DMSO control embryos showed a pattern similar to 5 μM CAPE. Similar results were observed in three independent experiments. (B) Morphology and pigmentation of CAPE-treated embryos at 2 dpf. Treated embryos showed reduced pigmentation and defects such as pericardial edema and a curved tail. (C) Melanocyte counts corresponding to (B). Trunk melanocytes were counted from the yolk sac extension to the end of the tail. Error bars represent standard deviation of 10 embryos from two independent experiments. (D) CAPE increases the fraction of dorsal melanocytes at 2 dpf. Melanocytes were counted as in (C). Embryonic stage at drug treatment is indicated. *p<0.05, **p<0.0005, unpaired t-test. Figure 4—figure supplement 1 shows the effect of CAPE on xanthophores and iridophores at 3 dpf. Figure 4—figure supplement 2 shows the effect of CAPE on otic vesicle development. |
| Gene: | |
|---|---|
| Fish: | |
| Condition: | |
| Anatomical Term: | |
| Stage: | Prim-5 |
| Fish: | |
|---|---|
| Condition: | |
| Observed In: | |
| Stage Range: | Prim-5 to Long-pec |