
Fig. S1
- ID
- ZDB-FIG-170922-43
- Publication
- Avitan et al., 2017 - Spontaneous Activity in the Zebrafish Tectum Reorganizes over Development and Is Influenced by Visual Experience
- Other Figures
- All Figure Page
- Back to All Figure Page
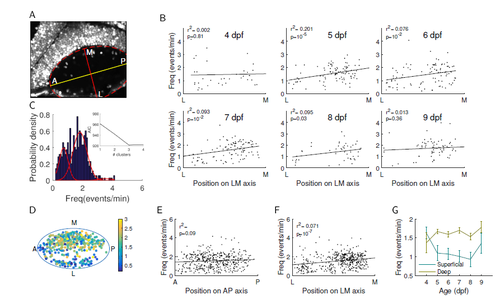
Neuropil (NP) neurons segregate in two populations, both spatially and functionally. Related to Figure 1. (A) An imaged tectum with an ellipse fitted to the NP area (dashed red line). The antero-posterior (AP, yellow) and latero-medial (LM, red) axes are represented by the two axes of the ellipse. (B) Position of neurons on the LM axis plotted against their event frequency, pooled over fish for each age, shows a significant correlation at 5-8 dpf. (C) Histogram of event frequency of NP neurons (blue) was fitted by a mixture of three Gaussians (red), as determined by the Akaike information criterion (AIC)(inset). This criterion provides a statistically principled way of trading off model complexity against data fit. (D) NP neurons from all ages shown on a common NP ellipse. Color codes each neuron’s event frequency (events/min). (E) Position of all NP neurons on the AP axis plotted against their event frequency shows no significant relationship. (F) Equivalent graph for the LM axis (pooled over all ages) shows a significant correlation. (G) After correction for multiple comparisons there were no significant changes in the frequency of superficial and deep NP neurons over development (one way ANOVA, Bonferroni correction). |