
Fig. S4
- ID
- ZDB-FIG-170815-12
- Publication
- Garcia et al., 2017 - Sheath Cell Invasion and Trans-differentiation Repair Mechanical Damage Caused by Loss of Caveolae in the Zebrafish Notochord
- Other Figures
- All Figure Page
- Back to All Figure Page
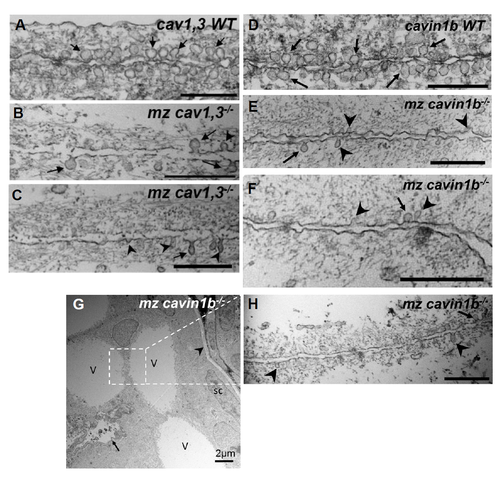
Ultrastructural analyses of caveolar mutants. Related to Figure 1, 2, 3 and 4. A-C: Transmission electron microscopy (TEM) images of 72 hpf WT and mz cav1, 3-/- larvae taken from areas of the inner notochord where two vacuolated cells meet. In WT we detected an average of 6 caveoalae per μm of plasma membrane, whereas there were only 1/μm in mz cav1, 3-/- larvae. Arrows point to omega shaped caveolae and arrowheads point to dysmorphic caveolae. D-F: TEM images of 72 hpf WT and mz cavin1b-/- larvae taken from areas of the inner notochord where two vacuolated cells meet. In WT we detected an average of 6.8 caveoalae per μm of plasma membrane, whereas there were only 1.5/μm in mz cavin1b-/- larvae. Arrows point to omega shaped caveolae and arrowheads point to dysmorphic caveolae. G: Low magnification TEM image of a mz cavin1b-/- larvae with a severe notochord lesion. Several newly vacuolated cells, marked V, were found next to the remnants of a collapsed primary vacuolated cell, marked with an arrow (see also Fig. 2D and Fig. 4). The arrowhead marks the matrix around the sheath, sc=sheath cell. H: TEM image of an area were to newly vacuolated cells meet. As shown for primary vacuolated cells, few caveolae are found at the plasma membrane (arrow) and dysmorphic caveolae (arrowheads) are also present. Scales bars are 500 nm. |