
Fig. 9
- ID
- ZDB-FIG-170807-39
- Publication
- Murphy et al., 2017 - Knockdown of epigenetic transcriptional co-regulator Brd2a disrupts apoptosis and proper formation of hindbrain and midbrain-hindbrain boundary (MHB) region in zebrafish
- Other Figures
- All Figure Page
- Back to All Figure Page
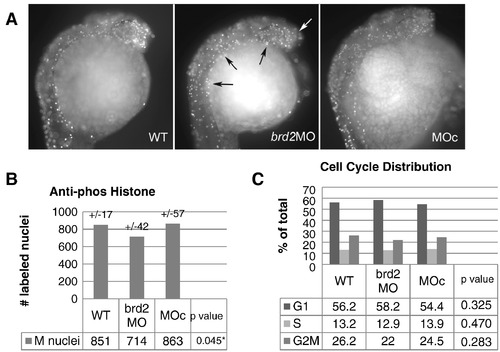
brd2aMO morphants exhibit levels of mitosis similar to controls. A) Anti-phosphohistone labeling of mitotic nuclei in prim 5 embryos. A total of 32 embryos from three clutches were used per treatment (WT, 8 ng brd2aMO1-injected, and 8 ng MOc-injected), and prim 5 stage embryos were analyzed using anti-phosphohistone H3 (anti-pH 3) antibodies followed by fluorescence microscopy. Dark field images of embryos exhibit no striking visual differences in overall levels of mitosis by treatment, but brd2aMO embryos often show ectopic mitoses at the embryo/yolk border (black arrows) and lack of mitoses in anterior telencephalon (white arrow). For quantitation in B), anti-pH 3-labeled nuclei in six optical fields for each of five embryos per treatment were counted manually using ImagePro Plus software. Mean total mitotic nuclei +/− SE for each treatment group are shown. Nested ANOVA reveals a small but significant difference (p = 0.045) among treatment groups, due mainly to brd2aMO vs MOc differences (Tukey's HSD). brd2aMO1 vs. WT differences tested below significance (p = 0.12). In contrast, WT vs. MOc differences were minimal (p = 0.98). C) Cell cycle phase distribution analysis of dissociated embryonic cells by flow cytometry. Clutches were divided into three treatment groups (WT uninjected, 8 ng brd2aMO1-injected, and 8 ng control MOc-injected), for a total of five clutches and 75–100 prim 5 embryos per treatment. Mean percentages of five trials are shown. No significant differences in phase distribution were found between treatments (one-way ANOVA and Tukey's HSD). |
Reprinted from Mechanisms of Development, 146, Murphy, T., Melville, H., Fradkin, E., Bistany, G., Branigan, G., Olsen, K., Comstock, C.R., Hanby, H., Garbade, E., DiBenedetto, A.J., Knockdown of epigenetic transcriptional co-regulator Brd2a disrupts apoptosis and proper formation of hindbrain and midbrain-hindbrain boundary (MHB) region in zebrafish, 10-30, Copyright (2017) with permission from Elsevier. Full text @ Mech. Dev.