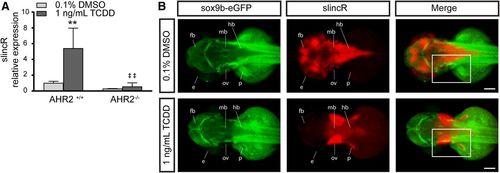
Comparative analysis of AHR2 functional status and slincR expression levels and spatial pattern relative to sox9b. (A) SlincR expression in 48 hpf wild-type 5D (AHR2+/+) and AHR2-null (AHR2−/−) whole embryos developmentally exposed to 0.1% DMSO (vehicle control) or 1 ng/ml TCDD (n = 3 biologic replications). Results were statistically analyzed using the GraphPad Prism 7.02 software. The data were tested for normality using the Shapiro-Wilk normality test, analyzed with two-way analysis of variance, and correction for multiple comparisons was performed using the Dunnett’s test (95% confidence intervals). Error bars indicate S.D. of the mean. **P < 0.01 compared with DMSO control. ##P < 0.01 compared with TCDD control. (B) Dorsal view of dual immunohistochemistry and in situ hybridization samples targeting sox9b-eGFP (green) and slincR (red) in 48 hpf embryos (n = 6–10 embryos). The Tg(−2421/+29sox9b:EGFPuw2) sox9b reporter line embryos were developmentally exposed to 0.1% DMSO or 1 ng/ml TCDD. In the TCDD-exposed samples, the regions with increased slincR expression had a corresponding decrease in sox9b-eGFP expression (white rectangle); e = eye, ov = otic vesicle, p = pectoral fin, fb = forebrain, mb = midbrain, and hb = hindbrain; 100 µm scale bar. All experiments were independently repeated a minimum of two times.
|
