
Fig. 5
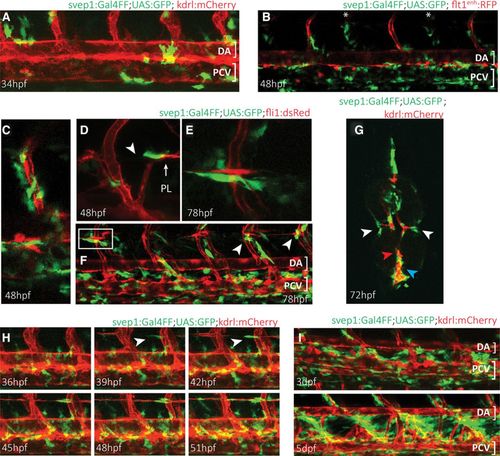
Zebrafish polydom/svep1 is expressed dynamically at regions of venous and lymphatic endothelial cell migratory activity. A, The first polydom/svep1 expression appears around 34 h post-fertilization (hpf) in nonendothelial cells along the dorsal aorta (DA) and posterior cardinal vein (PCV), as depicted by svep1:Gal4FF;UAS:GFP expression in a kdrl:mCherry transgenic background. B, By 48 hpf, the number of polydom/svep1-positive cells along the PCV has increased, and polydom/svep1-positive cells can abundantly be found in the immediate vicinity of both arterial (highlighted in red in flt1enh:RFP background) and venous (marked with asterisks) intersegmental vessels (ISVs). C, Higher magnification of an independent region at 48 hpf, demonstrating the tight connection between endothelial cells (red) and polydom/svep1-positive cells (green). D–F, Between 48 and 72 hpf, when parachordal lymphangioblast (PL) cells populate the horizontal myoseptum (HMS) region and start to migrate dorsally and ventrally along arterial ISVs, individual cells in the midline of the embryo start to express polydom/svep1. The polydom/svep1-expressing cells are in a immediate contact with migrating PL cells. G, Cross-section of a 72 hpf svep1:Gal4FF;UAS:GFP embryo in a kdrl:mCherry background. Note the close association of PL cells (red) and polydom/svep1-positive cells (green) in the HMS region (white arrow heads), and of PCV cells and polydom/svep1-positive cells (blue arrow head). The dorsal aorta (red arrow head) is not covered by polydom/svep1-positive cells at this time point any more. H, Still frames of a confocal time-lapse imaging of a svep1:Gal4FF;UAS:GFP;kdrl:mCherry embryo from 36 to 51 hpf. Polydom/svep1-positive cells (green) and PL cells (red) start appearing at the horizontal midline region around 39 hpf. Note the almost simultaneous appearance of both cell types. The full movie can be seen online. I, At 3 and 5 d post-fertilization (dpf), polydom/svep1 expression can be seen in between the DA and the PCV, exactly in the region, which the lymphatic cells of the future thoracic duct (TD) will populate. |
| Genes: | |
|---|---|
| Fish: | |
| Anatomical Terms: | |
| Stage Range: | Prim-15 to Day 5 |