
Fig. 3
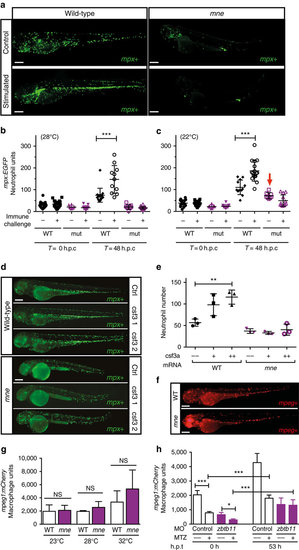
Zbtb11 deficiency results in failure of emergency granulopoiesis. (a) Fluorographs of representative embryos either unstimulated (control) or 48 h post challenge with frozen T. marneffei spores. (b) Graph showing enumeration of neutrophils in embryos raised at 28 °C; data from one representative experiment of three biological replicates; each point represents one embryo (from left to right: n=21, 24, 8, 13, 16, 11, 9, 20); mean ±s.d., Mann–Whitney test; ***P≤0.001; h.p.c., hours post challenge with frozen T. marneffei spores; (c) Enumeration of neutrophils raised at 22 °C (arrow indicates the number of unstimulated neutrophils in mne approaches that of WT at 22 °C); details as for (b) (from left to right: n=15, 16, 9, 13, 12, 16, 8, 12); one-tailed t-test; ***P≤0.001. (d) Overexpression of csf3a (G-CSF) results in vigorous stimulation of neutrophil expansion in WT but not mne embryos shown as mpx-EGFP+ fluorescent neutrophils; ctrl, control; csf3 1 and csf3 2, 0.05 ng and 0.1 ng of csf3a mRNA, respectively. (e) Enumeration of neutrophils in d. Mean ±s.e.m.; two-tailed t-test; n=3 biologically independent experiments; **P≤0.01). (f) Fluorographs of representative WT Tg(mpeg1:mCherry) and mne;mpeg1:mCherry embryos showing similar numbers of macrophages. (g) Enumeration of macrophages in f shows that at 48 h.p.f. macrophage development remains unaffected regardless of severity of marsanne phenotype. n=2 biologically independent experiments; mean ±s.e.m., two-tailed t-test; NS=P>0.05. (h) Macrophage development is independent of Zbtb11. Repopulation of macrophages following their selective ablation by metronidazole (MTZ) treatment of Tg(mpeg1:Gal4FF/UAS:nfsb-mCherry/mpx:EGFP) embryos occurs in both Zbtb11 and control morphants. Details as for b (from left to right: n=18, 18, 7, 12, 14, 16, 6, 12); *P≤0.05; ***P≤0.001; h.p.t., hours post treatment; scale bars, 200 μm (a,d,f). |
| Fish: | |
|---|---|
| Conditions: | |
| Observed In: | |
| Stage Range: | Long-pec to Day 4 |