
Fig. 1
- ID
- ZDB-FIG-170407-8
- Publication
- Markenscoff-Papadimitriou et al., 2014 - Enhancer interaction networks as a means for singular olfactory receptor expression
- Other Figures
- All Figure Page
- Back to All Figure Page
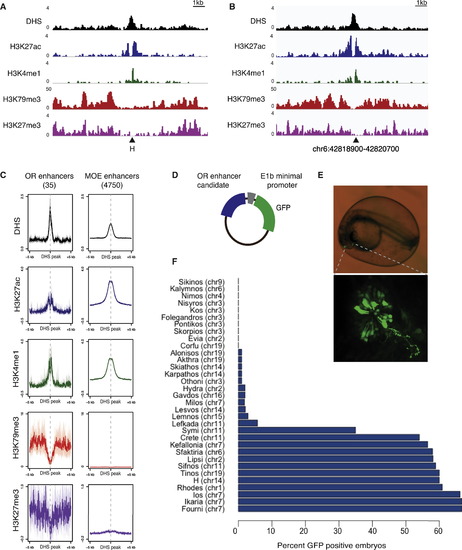
An Epigenetic Signature for Putative OR Enhancers (A) Sequencing tracks for DHS-seq and ChIP-seq. Each row displays the number of reads for each track. Triangle indicates H enhancer. (B) DHS-seq and ChIP-seq tracks over potential OR enhancer Sfaktiria (coordinates are mm9). (C) Aggregate plots of ChIP-seq and DHS-seq reads over all potential OR enhancers (left) and all potential MOE enhancers (right). y axis is RPKM, and error is bootstrapped 95% confidence intervals. x axis is centered at DHS peaks. (D) Schematic depicting the E1b-tol2 expression construct. (E) Zebrafish embryo injected with Sfaktiria-GFP at 24 hr postfertilization (hpf). Olfactory epithelium is indicated with dotted lines. Bottom, OSN cell bodies and axons expressing GFP. (F) Results of zebrafish enhancer screen. Percent of injected zebrafish embryos with GFP-positive olfactory neurons at 48 hpf for each OR enhancer candidate. See also Figure S1 and Tables S1 and S2. |
Reprinted from Cell, 159, Markenscoff-Papadimitriou, E., Allen, W.E., Colquitt, B.M., Goh, T., Murphy, K.K., Monahan, K., Mosley, C.P., Ahituv, N., Lomvardas, S., Enhancer interaction networks as a means for singular olfactory receptor expression, 543-57, Copyright (2014) with permission from Elsevier. Full text @ Cell