
Fig. 6
- ID
- ZDB-FIG-170310-11
- Publication
- Bloomekatz et al., 2017 - Platelet-derived growth factor (PDGF) signaling directs cardiomyocyte movement toward the midline during heart tube assembly
- Other Figures
- All Figure Page
- Back to All Figure Page
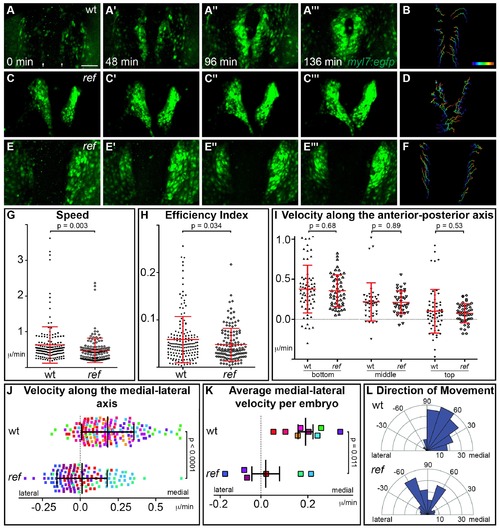
pdgfra regulates the directionality of cardiomyocyte movement. (A–F) Representative timelapse experiments indicate patterns of cell movement in wt (A,B) and ref mutant (C–F) embryos carrying the Tg(myl7:egfp) transgene. (A,C,E) Three-dimensional confocal reconstructions of select timepoints within each timelapse depict the typical changes in myocardial morphology seen over time in wt (A), mildly affected ref mutant (C) and severely affected ref mutant (E) embryos. (B,D,F) Tracks show the movements of the innermost cardiomyocytes in these embryos over the course of a ~2 hr timelapse. Cell tracks are colored from blue to red, indicating the location of each cell from the beginning to the end of its trajectory. See also Videos 1–3. Scale bar: 60 μm. (G–L) Quantitative analysis of cardiomyocyte movements. 168 and 137 cells were analyzed from eight wt and six ref mutant embryos, respectively. Graphs depict the average speed of individual cells (G, distance/time), the average efficiency index of individual cells (H, displacement/distance), the average velocity (displacement/time) of individual cells along the anterior-posterior axis (I) and along the medial-lateral axis (J), the average medial-lateral velocity per embryo (K), and the direction of the overall trajectory of individual cells (L). Dots in (J) are colored to depict the embryo to which they belong, and the same color scheme is used in (K). In (L), individual cells are grouped into 10 bins based on their net direction of movement; length of each radial bar represents the number of cells in each bin. The velocity along the medial-lateral axis (J,K) and the direction of cell trajectories (L) were significantly altered in ref mutants, indicating the misdirection of ref mutant cardiomyocytes and implicating pdgfra in steering the medial direction of cardiomyocyte movement. Error bars represent the standard deviation; p values were determined using Student’s T-test. |
| Gene: | |
|---|---|
| Fish: | |
| Anatomical Term: | |
| Stage: | 14-19 somites |
| Fish: | |
|---|---|
| Observed In: | |
| Stage: | 14-19 somites |