
Fig. 1
- ID
- ZDB-FIG-170309-24
- Publication
- Ehrlich et al., 2017 - Control of Movement Initiation Underlies the Development of Balance
- Other Figures
- All Figure Page
- Back to All Figure Page
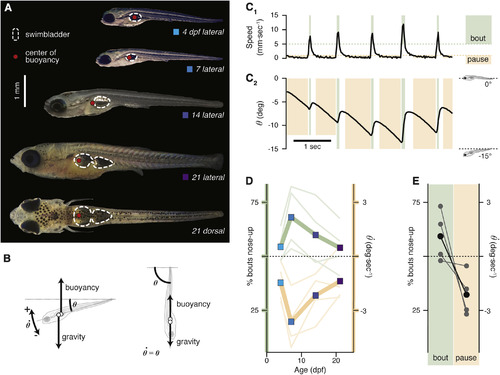
Swim Bouts Counteract Passive Instability (A) Representative photomicrographs depicting zebrafish throughout the larval stage, with centers of buoyancy delineated and swim bladders outlined in white. (B) Schematic of the relevant forces and postural variables for pitch-axis stability. The force of buoyancy acts at the center of buoyancy, which is offset caudally from the center of mass, where the net gravitational force acts (Figure S1). The angle of the longitudinal axis of the fish (dotted line) relative to the horizon (dotted line) in the nose-up/nose-down axis is the pitch angle, θ . The angular velocity, or rotation of the fish in the pitch axis, is represented by (C) A representative swimming epoch from a 7 dpf larva. Rhythmic spikes of translation speed delineate swim bouts (C1), which coincide with large changes to pitch angle (θ, C2). Shaded bands indicate windows of bouts (green) and pauses (tan). (D) Pitch-axis asymmetry of bouts and pauses are plotted as a function of age and clutch. The proportion of bouts with the fastest rotation in the nose-up direction is plotted in green. Corresponding mean angular velocity (E) Each line represents the average percentage of bouts in the nose-up direction (green shading) for a single clutch, paired with the corresponding mean angular velocity See also Figure S1, Tables S1 and S3, and Movies S1 and S2. |