
Fig. 6
- ID
- ZDB-FIG-170308-1
- Publication
- Shamay-Ramot et al., 2015 - Fmrp Interacts with Adar and Regulates RNA Editing, Synaptic Density and Locomotor Activity in Zebrafish
- Other Figures
- All Figure Page
- Back to All Figure Page
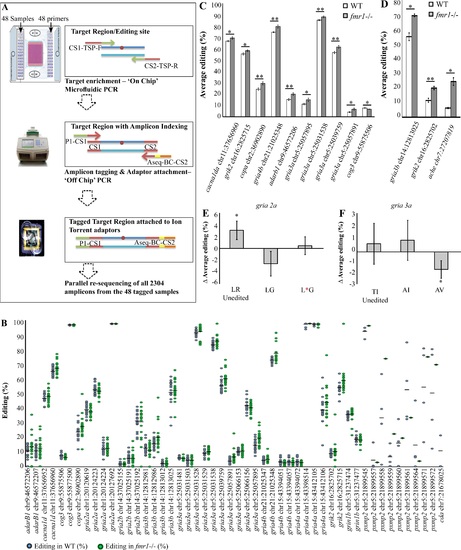
Targeted resequencing by mmPCR revealed differential RNA editing levels in fmr1-/- larvae. A. Schematic representation of the three major steps in the amplification and quantification of multiple RNA editing sites by next-generation sequencing. 1. A microfluidic-based PCR using the Fluidigm Access Array platform on the IFC chip (sample and primer inlets, black arrows) generates 48 targeted amplicons from 48 different samples. Schematic representation of the “on-chip” PCR; target regions (blue lines) contain a targeted RNA editing site (red circle) amplified by PCR with forward and reverse target-specific primers (TSP-F/TSP-R) fused to common sequences (CS1/CS2). 2. “Off-chip” PCR generates mini-library tagging, and the addition of IT-adaptor sequences creates 48 fully tagged and sequencer-compatible mini-libraries. Fusion primers containing CS1 and CS2 (red line primers) and the Ion Torrent PGM adaptor sequences P1 (green) and Aseq (orange) are used to generate completed amplicons (blue lines flanked by red lines). Barcode sequences (yellow) for sample indexing are fused to the Aseq-CS2 primer. 3. Parallel sequencing of the combined libraries on Ion Torrent-PGM. All mini-libraries are pooled together. B. Dot plot represents all calculated values of A/G ratios [percentages (dots) and means (black horizontal lines)] in the set of target sites that met all selection criteria in WT (blue circles) and fmr1-/- (green circles) RNA. C. The ten editing sites that exhibited significant differential RNA editing levels between fmr1-/- and WT larvae (n = 20 batches of 10 larvae for each genotype, *p<0.05, **p<0.005). D. Representative RNA editing sites showed increased editing levels in the brains of fmr1-/- zebrafish. gria3b showed a 14% increase, grik2 showed an 8% increase and ache showed an 18% increase (gria3b and grik2: WT, n = 4; fmr1-/-, n = 5; ache, n = 3 per genotype, one brain per sample, *p<0.05, **p<0.005). E-F. Genes with multiple editing sites located in close proximity in the same amplified target region, were analyzed to quantify the relative abundance of all possible protein combinations formed by the editing pattern. Grey bars represent differences in the relative abundance of mRNA transcripts between WT and fmr1-/- larvae. E. In gria2a, LR (Leucine, Arginine) represents the genomically encoded unedited version that exhibited a 2.6% difference in relative abundance (*p<0.05). F. In gria3a, AV (Alanine, Valine) represents the double-edited form that exhibited a 1.6% difference in relative abundance (*p<0.05). Values are represented as means ± SEM. Statistical significance was determined by two-sample t-test assuming unequal variances. |
| Fish: | |
|---|---|
| Observed In: | |
| Stage Range: | Long-pec to Day 6 |