
Fig. 2
- ID
- ZDB-FIG-170306-23
- Publication
- Kaltdorf et al., 2017 - FIJI Macro 3D ART VeSElecT: 3D Automated Reconstruction Tool for Vesicle Structures of Electron Tomograms
- Other Figures
- All Figure Page
- Back to All Figure Page
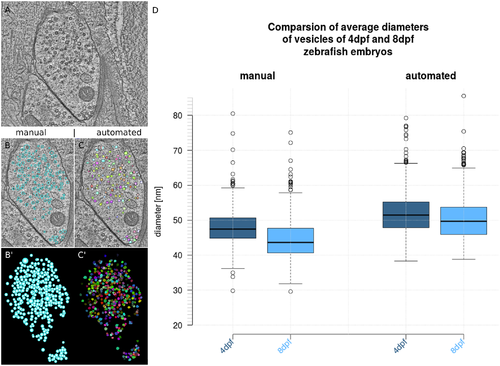
Analysis of embryonic zebrafish NMJ using 3D ART VeSElecT in comparison to manual analysis using IMOD. We show in Fig 2 A) the original tomogram of 4dpf zebrafish NMJ, in Fig 2 B) the manual reconstruction is included in the tomogram of A), in B') the 3D reconstruction of the manual annotation (vesicles are colored in light blue) is shown. This is compared to Fig 2 C) which shows the semi-automated vesicle recognition overlaid with the original tomogram, and C') which shows the vesicle pool of the semi-automated annotation as 3D reconstruction (vesicles are in arbitrary colors). In D) boxplots show the results of the comparison of 4dpf and 8dpf zebrafish embryos using manual annotation (left) and semi-automated annotation (right). The box of the box plots shows the mid-50% of data. The line in the box represents the median of all data. Whiskers end at lowest value within 1.5 interquartile range (IQR) of the lower quartile and at the highest value within 1.5 IQR of the upper quartile. Data that is not included in between both whiskers are plotted as outliers with a dot. |