
Fig. 3
- ID
- ZDB-FIG-170301-10
- Publication
- Reiten et al., 2017 - Motile-Cilia-Mediated Flow Improves Sensitivity and Temporal Resolution of Olfactory Computations
- Other Figures
- All Figure Page
- Back to All Figure Page
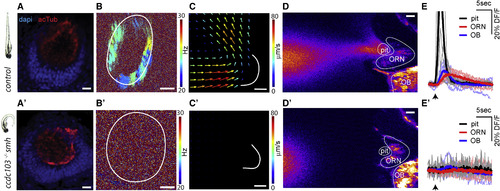
Lack of Ciliary Beating in the Multiciliated Cells of smh−/− Zebrafish Diminishes Flow Fields around the Snout, Hampers Attraction of Odors to Nose Pit, and Consequently Impairs Neural Responses to Odors in Stagnant Environments (A) The smh−/− larvae that are identified by their bend body axis (left) have a normal ciliary distribution in the nose pit, confirmed by acetyl-tubulin staining. (B and C) In the nose pit of smh−/− larvae, (B and B’) no ciliary beating (n = 9 for smh−/−, CBF = none; n = 10 for controls, CBF = 23.9 ± 1.2 Hz) and (C and C’) no flow fields (n = 3 for smh−/− and controls) are detected when compared to control animals. (D and E) Fluorescently labeled food odor is released from a capillary using a microinjector, and odor flow dynamics and neural responses to odors are imaged using two-photon microscopy in HuC:GCamp6s zebrafish expressing transgenic calcium indicators. No external flow is applied. (D and D') Raw video frames following microinjection were averaged. Note that the flow generated by motile cilia can attract odors to the nose pit in control zebrafish (D), whereas smh−/− larvae fail to attract odors (D’). (E and E') Time course of odor dynamics in the nose pit and neural responses to odors in ORNs and the OB in (E) control and (E') smh−/− larvae are represented as percentage change of fluorescence over time (DF/F). Note that in controls the odor is rapidly attracted and ejected from the nose pit (black), which results in transient odor responses in ORNs (red) and the OB (blue). In contrast, smh−/− larvae do not attract odor to the nose pit and thus ORNs and the OB do not display calcium activity. Light lines are individual traces, dark lines are average, and black arrows mark the time of odor injections. n = 7 (wild-type) and n = 6 (smh−/−). All scale bars represent 20 μm. See also Movies S4 and S5.. |
| Gene: | |
|---|---|
| Antibody: | |
| Fish: | |
| Anatomical Terms: | |
| Stage: | Day 4 |
| Fish: | |
|---|---|
| Observed In: | |
| Stage: | Day 4 |