
Fig. 2
- ID
- ZDB-FIG-170223-35
- Publication
- Jindal et al., 2017 - In vivo severity ranking of Ras pathway mutations associated with developmental disorders
- Other Figures
- All Figure Page
- Back to All Figure Page
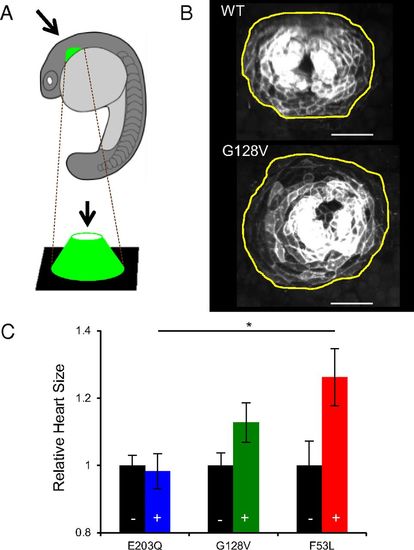
Ranking of MEK1 RASopathy mutations in the zebrafish heart. (A) Schematic of zebrafish orientation during heart imaging. (B) Representative images of the zebrafish heart at 19.5 hpf with the outline of the heart in yellow. Cardiac cells are labeled by membrane GFP expressed from the myl7 promoter. (Scale bar, 50 μm.) (C) Rank of selected mutations based on zebrafish heart size in embryos overexpressing MEK variants (+) compared with uninjected siblings (–, black). The average for each mutation is plotted with the SEM indicated. RASopathies, blue; RASopathies and cancer, green; cancer only, red. Here, N values are NE203Q,– = 12, NE203Q,+ = 9, NG128V,– = 12, NG128V,+ = 9, NF53L,– = 9, and NF53L,+ = 8. One-way analysis of variance (ANOVA) with Bonferroni correction was used for statistical analysis: *P < 0.1. The differences of the following pairs were not statistically significant: E203Q, G128V; G128V, F53L. |