
Fig. S6
- ID
- ZDB-FIG-170222-56
- Publication
- Lebedeva et al., 2017 - Characterization of genetic loss-of-function of Fus in zebrafish
- Other Figures
- All Figure Page
- Back to All Figure Page
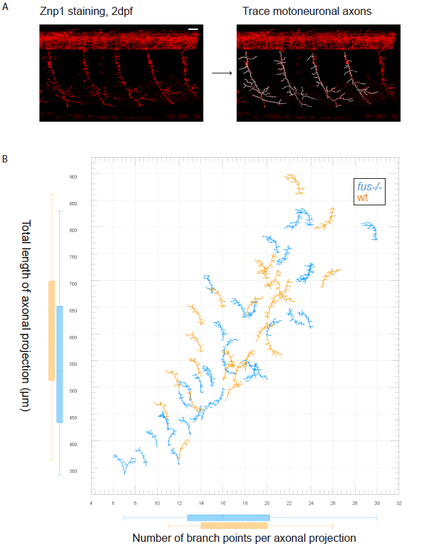
Analysis of axonal projection branching in wt and fus-/- 2dpf embryos with Imaris. (A) Example screenshots from the Imaris work area. The original trunk section is shown on the left, the same section with the overlay of traced motoneuronal projections to the right. Deconvolved images of Znp1 staining of trunk sections containing 4-5 axonal projections were used for analysis. Only one side of the trunk, either left or right, was imaged for clarity. Filaments package of Imaris was used for semiautomatic tracing of axonal projections. Scale bar is 20μm. (B) Scatterplot representing measurements from seven wild type and eight fus-/- trunk sections. In total, 36 fus -/- and 25 wt axonal projections were measured. Total length of axonal projection in μm is plotted against number of branching points per axonal projection. The plot was created with Vantage package of Imaris. Each data point is a representation of the corresponding Filament object. Starting point of the filament corresponds to the actual data point. Some filaments are inverted because the corresponding trunk was imaged in inverted orientation. Wt projections are shown in orange, fus-/- in blue. |
| Fish: | |
|---|---|
| Observed In: | |
| Stage: | Long-pec |