
Fig. 3
- ID
- ZDB-FIG-170130-16
- Publication
- Müller-Deile et al., 2016 - Overexpression of TGF-β Inducible microRNA-143 in Zebrafish Leads to Impairment of the Glomerular Filtration Barrier by Targeting Proteoglycans
- Other Figures
- All Figure Page
- Back to All Figure Page
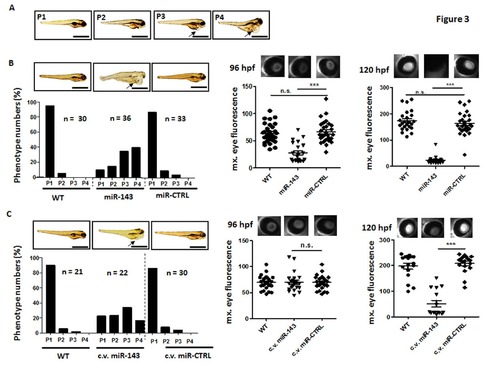
Overexpression of miR-143 causes edema and proteinuria in zebrafish larvae. Edema quantification of zebrafish larvae at 120 hpf. (A) Representative phenotype of the larvae categorized into 4 groups: P1 = no edema, P2 = mild edema, P3 = severe edema, P4 = very severe edema. Zebrafish were injected with a miR-143 mimic (5 μM) or miR-CTRL (5 μM) at one to four cell stage (B) or in the cardinal vein (c.v.) at 48 hpf (C) as indicated. Left panels depict phenotype percentages with corresponding representative phenotype images. Right panels indicate results of the eye assay for proteinuria with corresponding representative fluorescent images of the retinal vessel plexus of Tg(l-fabp:DBP:EGFP) of zebrafish larvae expressing a high molecular weight fluorescent protein in the circulation at 96 hpf and 120 hpf. Bar graphs presenting maximum fluorescence intensity of the fish eye as analyzed with image J. *** p<0.001, n.s. not significant; hpf: hours post fertilization. D: Q-PCR for relative sdc2, 3, 4 and vcan mRNA expression in whole zebrafish tissue at 120 hpf. Zebrafish were injected with a miR-143 mimic (5 μM) or miR-CTRL (5 μM) at one to four cell stage as indicated. Expression levels are compared to miR-CTRL and given as fold change. * p< 0.05, ** p<0.01, *** p<0.001. |