
Fig. 3
- ID
- ZDB-FIG-161227-9
- Publication
- Stoetzel et al., 2016 - A mutation in VPS15 (PIK3R4) causes a ciliopathy and affects IFT20 release from the cis-Golgi
- Other Figures
- All Figure Page
- Back to All Figure Page
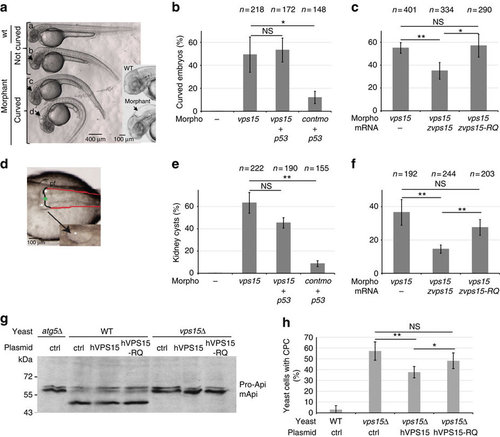
Zebrafish and yeast models to determine the VPS15-R998Q defects. (a) The vps15 morphants injected with vps15-mo (b–d) show different degrees of body axis curvature and hydrocephaly (black arrows and zoom) compared with the control (vps15cont-mo; a). For quantification, only phenotypes c and d were considered curved. Fifty-six hours post-fertilization embryos were used. (b) Percentage of curved embryos among the population injected with different combinations of morpholinos (Morpho). (c) Percentage of curved embryos upon co-injection with vps15-mo plus zVPS15 wild-type (VPS15) or zVPS15-RQ mRNA. In b and c, n indicates the number of injected embryos that were counted. Statistical significance was determined using the Student’s t-test, NS, non-significant, *P<0.05, **P<0.01 (d) Pronephric cysts (white stars) were observed in vps15 morphants. Black line: pronephric tubule; green dot: glomerulus; red line: pronephric duct; pf: pectoral fin. (e) Percentage of embryos forming kidney cysts upon injection with different combinations of morpholinos. (f) vps15 morphants co-injected with VPS15 wild-type or VPS15-RQ mRNA. In e and f, n indicates the number of injected embryos that were counted. Statistical significance was determined using the Student’s t-test, NS, non-significant, **P<0.01 (g) The wild-type (WT), atg5Δ and vps15Δ yeast cells bearing ctrl, hVPS15 or hVPS15-RQ plasmid, were grown under nitrogen deprivation for 4 h to induce autophagy and then collected. Western blot was performed to show the immature (proApi) and mature (mApi) forms of the vacuolar protease Api (Aminopeptidase 1). (h) vps15Δ yeast cells were transformed with the empty (ctrl), the wild-type hVPS15 or the mutant hVPS15-R998Q plasmid and the percentage of cells displaying an additional CMAC-positive compartment (CPC) was determined. At least 100 cells per experiment and transformant were counted. Graph shows mean of three experiments. Statistical significance was determined using the Student’s t-test, NS, non-significant, *P<0.05, **P<0.01. All the data shown in the figure are from at least three independent experiments and error bars represent s.d. |
| Fish: | |
|---|---|
| Knockdown Reagents: | |
| Observed In: | |
| Stage: | Long-pec |