
Fig. 2
- ID
- ZDB-FIG-161227-13
- Publication
- Kawashima et al., 2016 - The Serotonergic System Tracks the Outcomes of Actions to Mediate Short-Term Motor Learning
- Other Figures
- All Figure Page
- Back to All Figure Page
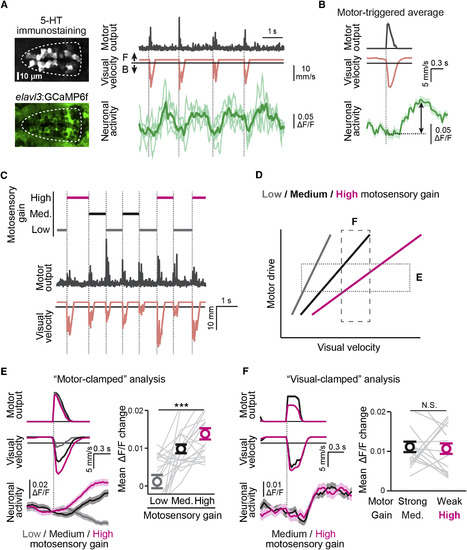
DRN Neurons Encode Sensory Feedback of Motor Action (A) High-speed imaging of DRN neurons. Left: 5-HT immunostaining and GCaMP6f. Right: fictive swim signal, visual motion and ΔF/F activity of four group 1 DRN neurons (thick line is average ΔF/F). (B) Example DRN neuron activity. Top: average locomotor drive across swim events aligned to bout onsets (dotted gray line). Middle: average visual velocity. Bottom: average ΔF/F of a group 1 DRN neuron. Black arrow: response magnitude used for analysis. Shadows, SEM across swim events. (C) Stochastic gain paradigm. In a closed-loop environment, at every bout (gray, middle), motosensory gain is set randomly to low (dark gray), medium (black) or high (magenta). (D) Analysis for (E) and (F). In motor-clamped analysis (E), visual coding is quantified by the dependence of the response on visual velocity within a restricted range of locomotor drive (data within horizontal bar). In visual-clamped analysis (F), motor coding is quantified by the dependence on locomotor drive within a restricted range of visual velocity (vertical bar). (E) Motor-clamped analysis of DRN neurons’ visual responses during the stochastic gain paradigm (see D). Left, average swim trace (top), visual motion (middle) and ΔF/F of a group 1 DRN neuron (bottom) under different motosensory gains. Right, dependence of group 1 DRN neurons’ responses under different motosensory gains. ∗∗∗p = 4.7 × 10⁻⁹ for effect of motosensory gain by linear mixed-effects model (LME), 21 fish. Error bars, SEM across fish. Gray lines, data from individual fish. (F) Visual-clamped analysis of motor-related responses of group 1 DRN neurons (see D). Left, example neuron with similar responses to events with different swim power but similar visual motion. Right, responses of DRN neurons across fish. Average response strength of group 1 neurons does not depend on locomotor drive. Error bars, SEM, 15 fish. Gray lines, data from individual fish. See also Figure S4. |
Reprinted from Cell, 167, Kawashima, T., Zwart, M.F., Yang, C.T., Mensh, B.D., Ahrens, M.B., The Serotonergic System Tracks the Outcomes of Actions to Mediate Short-Term Motor Learning, 933-946.e20, Copyright (2016) with permission from Elsevier. Full text @ Cell