
Fig. S2
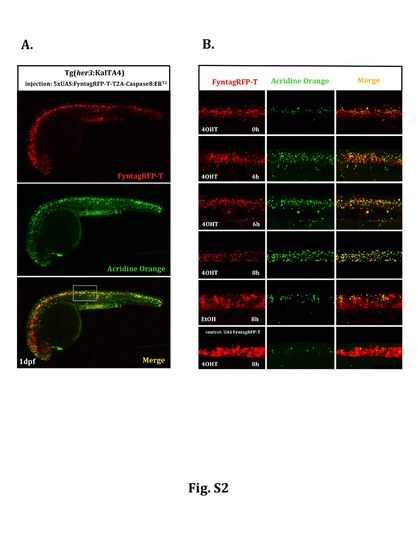
Temporal profile of apoptosis induction by inducible caspase. Heterozygous Tg(her3:KalTA4)hzm9Tg embryos were injected at the one cell stage with a plasmid carrying 5xUAS:FynTagRFP-T-T2A-Caspase8ERT2, followed by acridine orange staining on injected embryos at 24hpf. (A) Gal4/UAS-mediated tissue specific gene expression results in red fluorescent FyntagRFP-T positive cells throughout the ventral central nervous system including the brain, the spinal cord and the retina. Green fluorescent acridine orange staining was used to detect dying cells. To follow the time course of induction of apoptosis a region in the spinal cord marked by a white rectangle was analyzed at higher magnification. (B) In this spinal cord domain the number of green fluorescent dying cells (column in the middle) is increasing upon 4OHT treatment reaching highest levels around 8 hours after initiation of Tamoxifen incubation. Compared to normal developmental levels of apoptosis in embryos injected with the control plasmid 5xUAS:FynTagRFP-T (6th row), 5xUAS:FynTagRFP-T-T2A-Caspase8ERT2-injected embryos treated with EtOH showed an increase in apoptotic cell death (5th row) indicating that the activity of the inducible caspase is leaky under transient transgenic conditions, but can be induced to much higher levels of apoptosis upon Tamoxifen-mediated caspase activation (please compare 4th with 5th row). |