
Fig. 5
- ID
- ZDB-FIG-161220-4
- Publication
- Iwanami et al., 2016 - Forward Genetic Screens in Zebrafish Identify Pre-mRNA-Processing Pathways Regulating Early T Cell Development
- Other Figures
- All Figure Page
- Back to All Figure Page
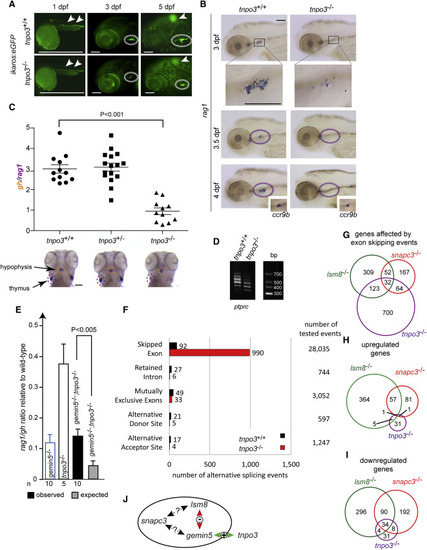
Characterization of tnpo3 Mutants, Related to Figure S5 (A) Reduction of ikaros-expressing cells in the thymus (encircled with dotted lines in middle and right panels) of homozygous tnpo3 mutants (additionally transgenic for an ikaros:eGFP reporter). Note the normal numbers of ikaros-positive cells in general hematopoietic tissues at 1 dpf. Scale bars, 100 μm. (B) Maturation block of thymocytes. Few ccr9b-positive thymocytes (insets in 4 dpf panels) in tnpo3 mutants express rag1. Scale bars, 100 μm. (C) Thymopoietic indices at 5 dpf. Each symbol represents one animal. The mean ± SEM is indicated. Scale bar, 100 μm. (D) Analysis of ptprc isoforms by RT-PCR; size markers are indicated. (E) Masking genetic interaction between gemin5 and tnpo3 mutations in zebrafish. The thymopoietic indices (rag1/gh ratio; mean values ± SD) at 5 dpf are given for fish (genotypes denoted in bars) resulting from crosses of parents heterozygous for both gemin5 and tnpo3; the observed thymopoietic index for gemin5−/−;tnpo3−/− double mutants is significantly higher than that expected from the indices of single mutants under the multiplicative model of genetic interaction. The numbers of fish in each group is indicated. (F) Alternative splicing events in tnpo3 mutants at 4 dpf. Bar chart shows the number of significant AS events per condition at a false discovery rate (FDR) of 1% for five different AS event types. The total numbers of tested AS events are indicated on the right. (G) Genes affected by exon-skipping events. (H) Genes exhibiting transcriptional upregulation. (I) Genes exhibiting transcriptional downregulation. (J) Summary of the network structure involving snapc3, lsm8, gemin5, and tnpo3 genes. +, alleviating genetic interaction; −, synthetic interaction; ?, unclear. |
| Genes: | |
|---|---|
| Fish: | |
| Anatomical Terms: | |
| Stage Range: | Prim-5 to Day 5 |
| Fish: | |
|---|---|
| Observed In: | |
| Stage Range: | Protruding-mouth to Day 5 |