
Fig. 4
- ID
- ZDB-FIG-161214-7
- Publication
- Oosterhof et al., 2017 - Identification of a conserved and acute neurodegeneration-specific microglial transcriptome in the zebrafish
- Other Figures
- All Figure Page
- Back to All Figure Page
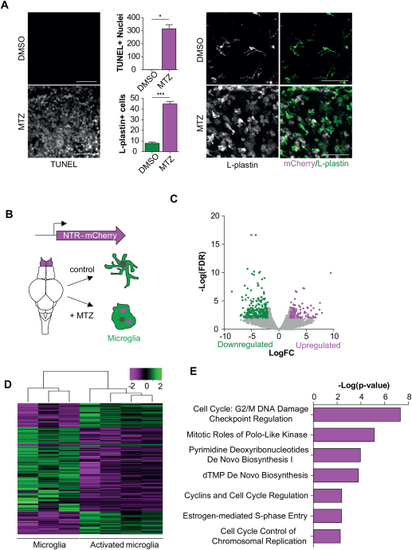
Identification of gene expression changes upon neuronal cell death. (A) TUNEL and L-plastin staining showing increased neuronal cell death upon treatment with MTZ for 48 hours accompanied by microglia activation. mCherry signal represents engulfed neurons. (B) Schematic representation of cells isolated for RNA sequencing on activated microglia. (C) Volcano plot showing differentially expressed genes upon the activation of microglia (FDR <0.01; LogFC > |2|). (D) Heatmap showing Z-score values of all genes differentially expressed between activated microglia and control microglia (367 genes) (FDR <0.01, LogFC > |2|).(E) IPA canonical pathway analysis on significantly upregulated genes in microglia upon NTR-mediated ablation (FDR <0.01;LogFC > |2|). Scale bar = 40 µm in (A). For quantification in (A) cells were counted in 3 selected volumes in the olfactory bulb (4.0 × 10 − 4 mm3) per fish (n = 3). Error bars represent standard deviation, *P < 0.05, ***P < 0.001 (Student's t-test). |