
FIGURE
Fig. 5
- ID
- ZDB-FIG-161205-18
- Publication
- Kumar et al., 2016 - Quantitative in vivo optical tomography of cancer progression & vasculature development in adult zebrafish
- Other Figures
- All Figure Page
- Back to All Figure Page
Fig. 5
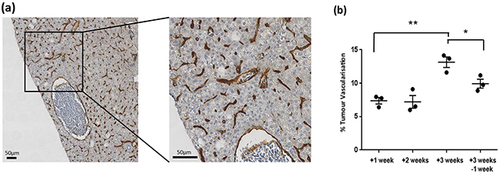
a. Representative IHC mCherry staining showing vessels (brown) from three week tumour induced adult TraNac Tg (KDR:mCherry:Fabp10-rtTA:TRE-eGFPKRASV12) zebrafish. Scale bar 50μm. b. Graph showing IHC mCherry quantitative analysis of percent vessel coverage over regions of interest. Each group (n =3) and error bars represent the SEM. *p<0.05, **p<0.01 as indicated by lines. |
Expression Data
| Gene: | |
|---|---|
| Fish: | |
| Condition: | |
| Anatomical Term: | |
| Stage: | Adult |
Expression Detail
Antibody Labeling
Phenotype Data
| Fish: | |
|---|---|
| Condition: | |
| Observed In: | |
| Stage: | Adult |
Phenotype Detail
Acknowledgments
This image is the copyrighted work of the attributed author or publisher, and
ZFIN has permission only to display this image to its users.
Additional permissions should be obtained from the applicable author or publisher of the image.
Full text @ Oncotarget