
Fig. 3
- ID
- ZDB-FIG-161122-12
- Publication
- Pérez-Schuster et al., 2016 - Sustained Rhythmic Brain Activity Underlies Visual Motion Perception in Zebrafish
- Other Figures
- All Figure Page
- Back to All Figure Page
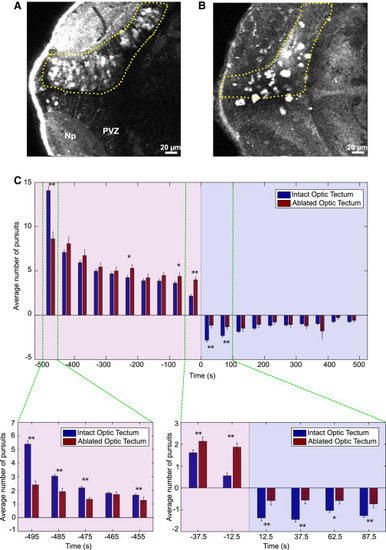
Ablation of the Optic Tectum Impairs the Generation of MAE (A) An optical plane of the HuC:GCaMP5 zebrafish tectum after two-photon laser ablation. For visualization purposes, ablation of a single tectal hemisphere is shown. For the experiments, both hemispheres were ablated. Note the large increase in fluorescence of the ablated neurons with respect to the intact hemisphere. (B) As in (A), but after labeling with acridine orange to label apoptotic neurons. The labeling was performed immediately after the behavioral experiments (1 day after the ablation). (C) Top: summary of the behavioral experiments after tectal ablations. The chart shows the average number of pursuits during the CS and the post-CS periods. Pink background, CS period; violet background, post-CS control period; blue bars, control (intact optic tectum); red bars, ablated optic tectum; positive values, pursuits in the direction of the CS; negative values, pursuits in the MAE direction. Asterisks mark significant differences (∗p < 0.05, ∗∗p < 0.01, Kruskal-Wallis; n = 26 trials from 4 larvae). Error bars, SE. Bottom: expanded timescale of the indicated regions above (green dashed lines). Note the weak initial behavioral response to the CS in ablated larvae and the much weaker optokinetic MAE-like behavior in ablated larvae compared to intact larvae. |