
Fig. S3
- ID
- ZDB-FIG-160901-7
- Publication
- Casano et al., 2016 - Developmental Apoptosis Mediates Entry and Positioning of Microglia in the Zebrafish Brain
- Other Figures
- All Figure Page
- Back to All Figure Page
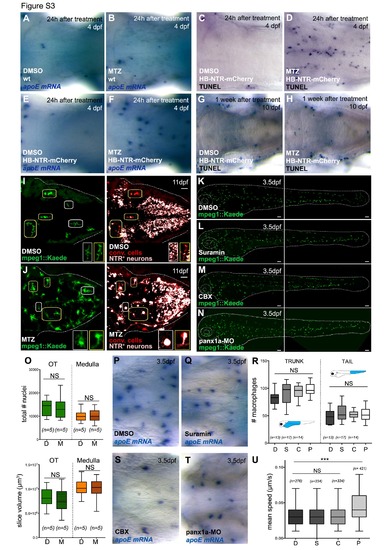
Ectopic neuronal cell death and nucleotide signaling affect microglial cell number. Related to Figure 2 and Figure 4. (A and B), (E and F) WISH using the microglial marker apoE in a 4 days old wild type (A-B) and HB-NTR- mCherry (E-F) embryo, 24h after DMSO or MTZ treatment. (C and D), (G and H) TUNEL staining showing apoptotic cells in the hindbrain of a representative HB-NTR-mCherry embryo 24h (C-D) and 1 week (G-H) after a pulse treatment of DMSO or MTZ. (I and J) Dorsal view of a representative mpeg1::GAL4-UAS::Kaede; HB-NTR-mCherry larva one week after DMSO (I) or MTZ (J) treatment and microglia photo-conversion in the hindbrain. Panels on the left show all microglial cells (Kaede green); panels on the right show photo-converted microglia (Kaede red) and NTR-mCherry+ neurons (in pink). Yellow and white boxes indicate examples of photo-converted cells and newly entered macrophages, respectively (higher magnifications in the insets). (K-N) Lateral view of a representative mpeg1::GAL4-UAS::Kaede embryo at 3.5dpf, 24h after treatment with DMSO, suramin, CBX or pannexin1a-MO. Dotted lines mark the embryo outline. (O) Quantification of nuclei (graph on the top) and slice volume (graph on the bottom) in the optic tectum and medulla oblongata of HB-NTR-mCherry juvenile fish, ~1 month after DMSO or MTZ treatment. Data from 3 independent experiments. n, number of analyzed fish. (P and Q), (S and T) WISH for apoE in a representative wild type embryo treated with DMSO, suramin, CBX or pannexin1a-MO. (R) Macrophage quantification in 3.5dpf mpeg1::GAL4-UAS::Kaede embryos treated as indicated in (K-N). Cells are quantified in the trunk and the tail as indicated in blue in the schematic. Data from 2 independent experiments. n, number of analyzed embryos. (U) Quantification of the basal motility of trunk macrophages in mpeg1::GAL4-UAS::Kaede embryos at 3.5dpf, 24 hours after drug treatment. Data from 2 independent experiments. n, number of analyzed cells. Dotted lines represent the embryo outline. D, DMSO. M, MTZ. S, suramin. C, CBX. P, pannexin1a- MO. Scale bar, 30µm. NS, non significant. *** p < 0.001. |