
Fig. 1
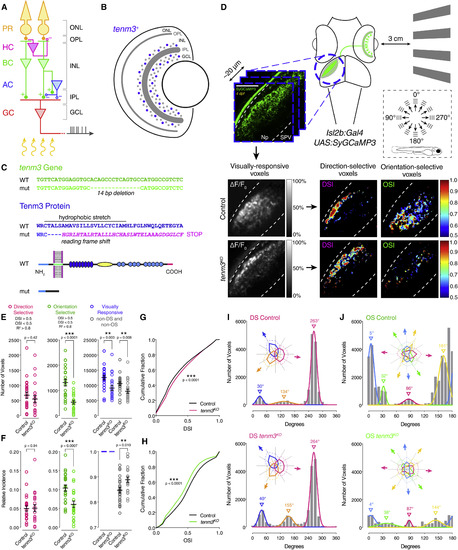
Tenm3 Is Required for RGC Orientation Selectivity (A) Basic neural circuit structure of the vertebrate retina. Cell classes are represented in colors, whereas layers are shown in black. Excitatory synapses are indicated by “+” (filled circles), inhibitory synapses are labeled with “-“ (empty circles). PR, photoreceptor; HC, horizontal cell; BC, bipolar cell; AC, amacrine cell; RGC, retinal ganglion cell; ONL, outer nuclear layer; INL, inner nuclear layer; GCL, ganglion cell layer; OPL, outer plexiform layer; IPL, inner plexiform layer. (B) Schematic showing tenm3 mRNA expression in the retina of zebrafish larvae. Blue circles indicate tenm3+ ACs and RGCs. Adapted from Antinucci et al. [17]. (C) TALEN-mediated tenm3 gene knockout (top) and consequent structural changes in the Tenm3 protein (bottom). (D) Functional calcium imaging of RGC axon terminals expressing SyGCaMP3 (green) in 4-dpf Tg(isl2b:Gal4;UAS:SyGCaMP3) larvae. Distance of right eye from projection screen is 3 cm. Recordings are performed from two to four Z-planes (approximately 20 µm total volume thickness) in the contralateral optic tectum. Dashed box shows the angles of moving bars relative to zebrafish larva orientation. Mean ΔF/F0 images of calcium recordings in control and tenm3KO larvae followed by mapping of DS and OS voxels are displayed. Np, neuropil; SPV, stratum periventriculare; DSI, direction selectivity index; OSI, orientation selectivity index. Scale bar, 40 µm. (E and F) Average number (E) and relative frequency (F) of DS, OS, visually responsive, and non-DS/non-OS voxels per Z-plane in control (n = 23 larvae) and tenm3KO (n = 22 larvae) 4-dpf larvae. Criteria used to identify DS and OS voxels are reported at the top. Error bars, ±SEM. **p < 0.01, ***p < 0.001, unpaired two-tailed Student’s t test. (G and H) Cumulative distributions of DSI values (R2 > 0) across voxels with OSI < 0.5 (G) and OSI values (R2 > 0) across voxels with DSI < 0.5 (H) in control and tenm3KO larvae. ***p < 0.001, two-sample Kolmogorov-Smirnov test. (I and J) Cumulative histograms summarizing the incidence of preferred angles for identified DS (I) and OS voxels (J) in control (n = 23; top) and tenm3KO (n = 22; bottom) 4-dpf larvae. Overlaid curves are the fitted Gaussian distributions for each DS or OS subtype. Polar plots illustrate the mean (+1 SD) normalized response profiles for each DS or OS subtype. See also Figure S1, Table S1, and Movie S1. |
| Gene: | |
|---|---|
| Fish: | |
| Anatomical Terms: | |
| Stage: | Day 4 |
| Fish: | |
|---|---|
| Observed In: | |
| Stage: | Day 4 |