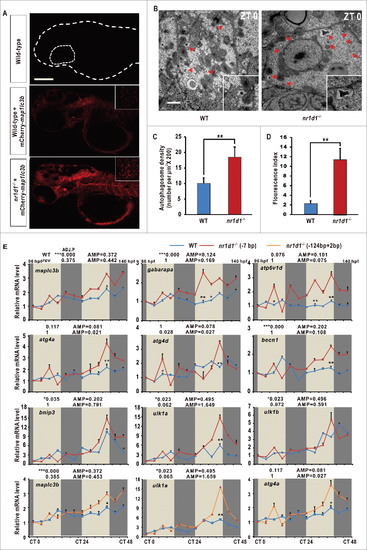
Disrupted autophagy activities and altered expression of autophagy genes in nr1d1 mutant zebrafish. (A) Zebrafish larval autolysosomes were estimated by expression of mCherry-Map1lc3b at 56 hpf. The scale bar in the lower left of the wild-type panel represents 100 microns. The right upper panels show high magnification highlighting a hindbrain region in both wild-type and nr1d1 mutant larva labeled with mCherry-Map1lc3b. (B) Transmission electron micrograph of wild-type and nr1d1 mutant liver sections at ZT 0. The scale bar in the lower left of the wild-type panel represents one micron. (C) Quantification of autolysosomes in (A), calculated manually. (D) Quantification of autophagosome abundance in (B) with software ImageJ. The figure represents one of the 3 independent sets of samples. Data represent mean ± s.d.(**, Pd0 .01). The Student t test was conducted, (**, P ≤ 0 .01). (E) RT-PCR analysis of autophagy genes in nr1d1 (7bp or +124,-2bp) mutant zebrafish at different time points under DD condition. Zebrafish larvae were raised under light/dark (14 h/10 h) condition for the first 3 dpf, and then placed under constant darkness condition. Approximately 50 zebrafish larvae were pooled for each time point. The mRNA expression levels were analyzed by the JTK-CYCLE method. ADJ.P for adjusted minimal p-values (*, P ≤ 0 .05; ***, P ≤ 0 .001), AMP for amplitude. Two-way ANOVA with the Tukey post hoc test was conducted (*, P ≤ 0 .05; **, P ≤ 0 .01).
|
