
Fig. 3
- ID
- ZDB-FIG-160809-10
- Publication
- Hudish et al., 2016 - miR-219 regulates neural progenitors by dampening apical Par protein-dependent Hedgehog signaling
- Other Figures
- All Figure Page
- Back to All Figure Page
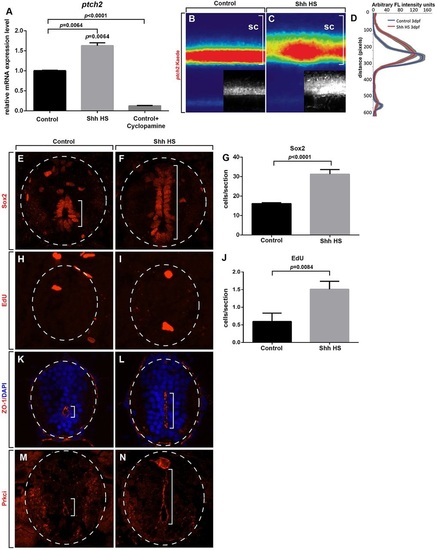
Shh overexpression phenocopies loss of miR-219 function. (A) Graph showing that 3dpf heatshocked Tg(hsp70l:Shha-EGFP) (Shh HS) larvae express ptch2 at higher levels than controls and that cyclopamine treatment almost abolishes ptch2 mRNA levels. Data represent the mean±s.e.m. (n=2 biological replicate experiments, consisting of 15-20 larvae, each). Significance calculated using an unpaired t-test. (B,C) Heat maps showing the average normalized fluorescence profile of control (n=21) and Shh HS (n=21) spinal cord (sc, brackets) ptch2:Kaede expression at 3dpf, straightened and aligned along the dorsoventral axis. Dorsal is to the top. All heat maps display in the range of 0-150 arbitrary fluorescence units (blue to red). Insets show representative maximum projection images of confocal stacks obtained from single larvae. (D) Average normalized fluorescence profile of ptch2:Kaede generated by creating line scans along the dorsoventral axis. The solid colored lines (red and blue) represent the average normalized fluorescence profile at each pixel along the dorsoventral axis whereas the grey lines represent the s.e.m. at each pixel. Control (E,H,K,M) and heat-shocked Tg(hsp701:Shha:EGFP) (Shh HS) (F,I,L,N) embryos shown in transverse section with dorsal up. Dashed circles outline the spinal cord and brackets indicate the central canal/primitive lumen. (E,F) Immunohistochemistry to detect neural progenitors, marked by Sox2 expression. (G) Graph showing the number of Sox2+ cells in control and Shh-overexpressing embryos. Data represent the mean±s.e.m. (n=15 embryos per group from 3 independent experiments). Significance calculated using an unpaired t-test. (H,I) EdU incorporation to detect dividing neural progenitors. (J) Graph showing the number of EdU+ cells in the spinal cord at 3dpf. Data represent the mean±s.e.m. (n=20 embryos per group). Significance calculated using an unpaired t-test. (K-N) 3dpf Shh-overexpressing embryos maintain a primitive lumen marked by apically localized ZO-1 and Prkci. |