
Fig. 1
- ID
- ZDB-FIG-160726-1
- Publication
- Heckel et al., 2015 - Oscillatory Flow Modulates Mechanosensitive klf2a Expression through trpv4 and trpp2 during Heart Valve Development
- Other Figures
- All Figure Page
- Back to All Figure Page
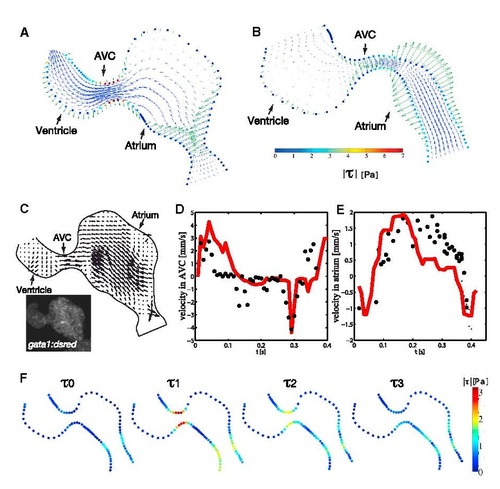
Oscillatory Flow Has a Stereotypical Distribution in the Embryonic Heart (A and B) Instantaneous flow field (blue flow arrows) and wall shear stress magnitude |τ| (color-coded dots marking the wall) during forward (A) and reversing (B) flow, as predicted by our model. Green arrows show the estimated wall velocity vectors imposed as boundary conditions. (C) In vivo flow measurement using Tg(gata1:dsred) embryos and PIV was used to test the model. (D and E) Velocity magnitude through the center of the AVC (D) and atrium (E) versus time. Negative velocities denote reversing flow. Solid red line, model prediction; black dots, in vivo particle tracking. (F) Frequency content (up to f = 3f1) of the WSS at several control points at the wall. τn is the amplitude of the frequency f = nf1 (τ0 and τ1 correspond to the average shear stress and the fundamental frequency f1, respectively). See also Movies S1 and S2. |
| Gene: | |
|---|---|
| Fish: | |
| Anatomical Term: | |
| Stage: | Long-pec |