
Fig. S2
- ID
- ZDB-FIG-160701-9
- Publication
- Richardson et al., 2016 - Leader Cells Define Directionality of Trunk, but Not Cranial, Neural Crest Cell Migration
- Other Figures
- All Figure Page
- Back to All Figure Page
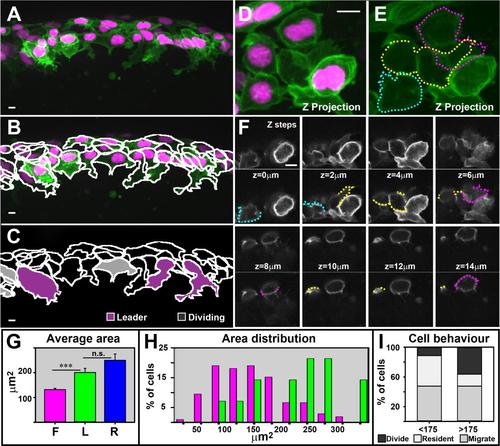
Leader and follower cells present characteristic morphologies before the initiation of migration.
(A) Picture of representative embryo premigratory area before the initiation of migration, (B) with cell outlines and (C) with leaders in purple and cell that divide within 90′ in grey (excluded from analysis). (D-F) Example of the manner in which cell outline was defined. Magnification bar 10µm. (D) Magnified picture of representative embryo premigratory area before the initiation of migration, (E) with cell outlines and (F) zplanes corresponding to the image. Top panel shows the membrane fluorescence image, bottom panel the outline of the membrane draw for each picture, that were all combined in E. Magnification bar 5µm. (G) Average areas of follower and leader cells are significantly different. Leader and rescuing cells area are not significantly different. (H) Area distribution of premigratory cells. (I) Behavior of small >175µm or big <175µm cells after leaders have initiated their migration. Half of the big or small cells migrate as followers. From the cells that remain premigratory big cells tend to divide more that small cells. n numbers F=105, L=14, 6 embryos. Error bars SEM. Lateral views, anterior left, dorsal top. All error bars 10. See also Movies S5. |