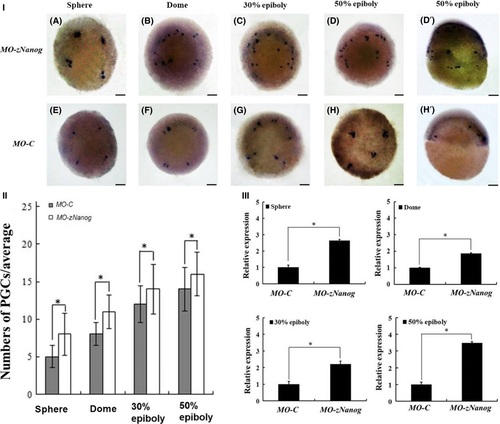
Depletion of zNanog by MO-zNanog increases the Vasa-positive cells and Vasa mRNA expression in embryos. (I) Analysis of proliferation and localization of Vasa positive cells in MO-zNanog embryos by whole mount in situ hybridization. Scale bars: 0.5 mm in all panels. A-D′: The MO-zNanog embryos (A: sphere stage, B: dome stage; C: 30% epiboly stage, D and D′: 50% epiboly stage). E-H′: The wild type embryos. A-D and E-H: Top views. D′ and H′: Lateral views. (II) Numbers of Vasa-positive cells in embryos as detected by whole mount in situ hybridization using Vasa probes. Histogram representing the numbers of Vasa-positive cells in MO-zNanog and wild type embryos of the sphere, dome, 30% epiboly, and 50% epiboly stages. n represents the total numbers of embryos from three different experiments. *P < 0.05; **P < 0.005. (III) qRT-PCR analysis of Vasa expression in the different stages of MO-zNanog and wild type embryos. Sphere, dome, 30% epiboly, and 50% epiboly stages from each bar graph represents the ratio of relative gene expression related to β-actin (internal control). The data represent the means ± SD (error bars).*P < 0.05; **P < 0.005.
|
