
FIGURE
Fig. 3
- ID
- ZDB-FIG-160606-5
- Publication
- Sepich et al., 2016 - Intracellular Golgi Complex Organization Reveals Tissue Specific Polarity during Zebrafish Embryogenesis
- Other Figures
- All Figure Page
- Back to All Figure Page
Fig. 3
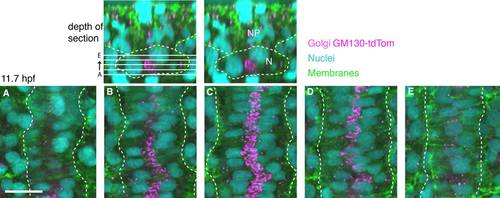
The GC position relative to the nucleus in notochord cells. Top: Transverse views of dorsal side of 5 somite stage wild-type with notochord and somites outlined. Left: Location of sections. Right: Notochord (N), neural plate (NP). A-E: Confocal optical slices spaced 2.5 µm apart. GC (antibody to GM130, magenta), nuclei (DAPI, cyan), and cell membranes (green). Dotted white line highlights lateral edges of the notochord. Scale bar = 20 µm. |
Expression Data
Expression Detail
Antibody Labeling
Phenotype Data
Phenotype Detail
Acknowledgments
This image is the copyrighted work of the attributed author or publisher, and
ZFIN has permission only to display this image to its users.
Additional permissions should be obtained from the applicable author or publisher of the image.
Full text @ Dev. Dyn.