
Fig. S4
- ID
- ZDB-FIG-160603-11
- Publication
- Foglia et al., 2016 - Multicolor mapping of the cardiomyocyte proliferation dynamics that construct the atrium
- Other Figures
- All Figure Page
- Back to All Figure Page
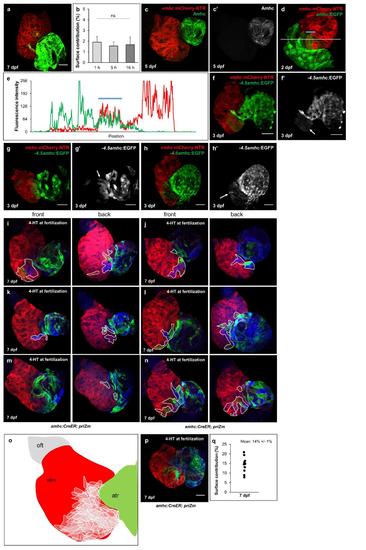
amhc:CreER-expressing cardiomyocytes are transient and localized to the ventricular apex and atrio-ventricular junction. (a) Surface myocardium of a 7 dpf amhc:CreER; β-actin2:RSG heart from an animal treated with 4-HT for 1 hour at 3 dpf, indicating areas of EGFP fluorescence. (b) Percentage of the ventricular surface area with EGFP fluorescence in 7 dpf amhc:CreER; β-actin2:RSG hearts, after treatment with 4-HT at 3 dpf for 1 hour (n = 11 hearts), 5 hours (n = 14 hearts) or 16 hours (n = 9 hearts) (mean +/- SEM). Differences in the means are not significant (ns) by one-way ANOVA (p > 0.05) after arcsine transformation. (c, c′) Surface myocardium of a 5 dpf vmhc:mCherry-NTR heart stained for Amhc, immunofluorescence, indicating no detectable ventricular Amhc. (d, e) Surface myocardium of a 2 dpf amhc:EGFP; vmhc:mCherry-NTR heart indicating some amhc:EGFP fluorescence in the ventricle. White bar indicates measured region for fluorescent intensity profile. Graph plots mCherry and EGFP fluorescent intensity in arbitrary units from 0-256 with position on x-axis indicating distance along the white line in (D). Blue bar indicates a region of EGFP and mCherry co-expression. Scale bars are 50 µm. (f-h) Images of 3 dpf hearts from vmhc:mCherry-NTR animals injected immediately after fertilization with a linearized plasmid containing an EGFP sequence preceded by a 4.5 kb region of the amhc promoter. Arrows indicate regions of EGFP fluorescence in the ventricle. Scale bars are 50 µm. (i-n) Surface myocardium of 7 dpf hearts (front and back) from amhc:CreER; priZm animals treated with 4-HT for 24 hours immediately after fertilization. Non-red cardiomyocytes in the ventricle are outlined in white. (o) Cartoon of generic 7 dpf ventricle overlaid with outlines from (C-H) to demonstrate localization of labeled ventricular cardiomyocytes. (p) Surface myocardium of a 7 dpf heart from an amhc:CreER; priZm animal treated with 4-HT for 24 hours immediately after fertilization. Scale bar is 50 µm. (q) Percentage of the ventricular surface area expressing non-red fluorescent proteins at 7 dpf when treated with 4-HT after fertilization (mean +/- SEM, n = 11 hearts). |