
Fig. 3
- ID
- ZDB-FIG-160418-3
- Publication
- Diaz-Tellez et al., 2016 - The Zebrafish scarb2a Insertional Mutant Reveals a Novel Function for the Scarb2/Limp2 Receptor in Notochord Development
- Other Figures
- All Figure Page
- Back to All Figure Page
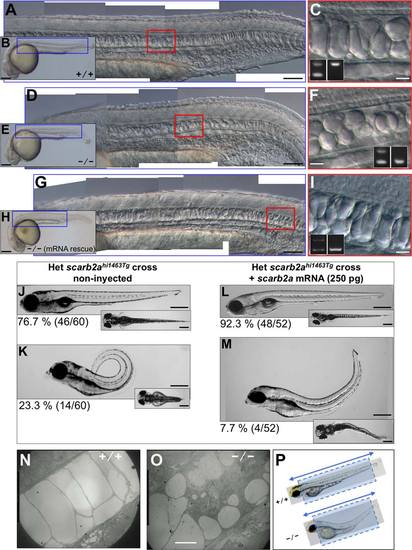
scarb2a mutant notochord and trunk defects. All embryos and larvae were obtained from scarb2ahi1463Tg heterozygous parents. A-C,J,L,N: Images from nonphenotypic (noncarrier) zebrafish embryos and larvae. D-I,K,M,O: Embryos or larvae homozygous for the scarb2ahi1463Tg mutagenic insertion. A,D,G: DIC microscopy images, composites of several photos obtained at 10X, corresponding to regions indicated in the blue boxes of low-magnification photos (B,E,H), respectively, but zoomed 5 times larger, allowing the observation of notochord characteristics in detail. C,F,I: The regions in red boxes in (A,D,G), respectively, zoomed 4 times larger to see the shape of notochord vacuoles; these images were obtained at 20X. Insets show the genotyping analysis demonstrating that the images in (A-C) were from a noncarrier embryo, images in (D-F) correspond to an homozygous mutant embryo, and the images in (G-I) were also from a homozygous embryo that does not show the small vacuole phenotype due to the micro-injection of scarb2a mRNA. A,D,G and C,F,I: Embryos at 1 dpf obtained with 10X and 20X objectives, respectively, using DIC microscopy. J-M: Rescue experiment showing 5 dpf non-microinjected larvae to the left and microinjected larvae to the right, in side views. Insets show the same larvae in dorsal views. While 23.3% of non-microinjected larvae from a scarb2ahi1463Tg heterozygous cross show the trunk upward-bending defect (phenotype), only 7.7% of the scarb2a mRNA microinjected larvae show the same defect, and it is less severe. The number in parentheses is the proportion of phenotypic larvae with respect to total larvae in the experiment. N,O,P: Electron Microscopy of WT and scarb2ahi1463Tg homozygous 3 dpf larvae. Longitudinal sections (dotted boxes) were obtained from sections made in the direction of the double arrowed line. A-M: These fish were genotyped as described in the Experimental procedures section. Scale bars = 250 µm in (B,E,H,J-M) 100 µm in (A,D,G) 20 µm in (C,F,I,N,O) respectively. |
| Fish: | |
|---|---|
| Observed In: | |
| Stage Range: | Prim-5 to Protruding-mouth |