
Fig. 7
- ID
- ZDB-FIG-160411-8
- Publication
- Lemmens et al., 2016 - Matrix metalloproteinases as promising regulators of axonal regrowth in the injured adult zebrafish retinotectal system
- Other Figures
- All Figure Page
- Back to All Figure Page
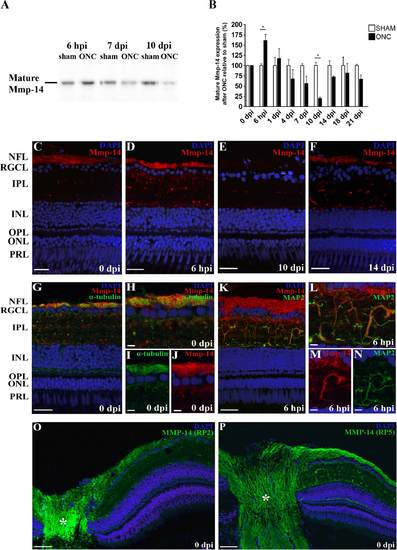
Retinal spatiotemporal expression pattern of Mmp-14 protein after ONC in adult zebrafish. A,B: Representative picture and bar graph revealing western blotting analysis data for Mmp-14 on retinal extracts after ONC, respectively showing significantly increased mature Mmp-14 (55-60 kDa) levels at 6 hpi and decreased levels at 10 dpi. Values from ONC samples were plotted relative to sham-operated values, which were put at 100%. Data represent at least three retinal samples per timepoint and are shown as mean ± SEM (*P < 0.05). C-F: Immunostainings for Mmp-14 on retinal sections harvested at varying days after ONC equally show an upregulation of Mmp-14 in the nerve fiber layer (NFL) and inner plexiform layer (IPL) at 6 hours postinjury (hpi) and a decrease herein during axonal regrowth. G-J: Double staining for α-tubulin and Mmp-14 indicates expression of Mmp-14 in/on RGC axons in retinal sections of control sham-operated fish. H-J: High- magnification pictures of double (H) and single (I,J) stainings. K-N: Double labeling of retinal sections for MAP2 and Mmp-14 reveals Mmp-14 expression in IPL neurites at 6 hpi. L-N: High- magnification pictures of double (L) and single (M,N) stainings. O-P: Additional immunostainings on zebrafish retinal sections at 0 dpi, using two alternative antibodies for MMP-14, RP2-MMP-14, and RP5-MMP-14 (Triple Point Biologics, ATK-MMP-14) confirm Mmp-14 expression in the NFL and IPL neurites. * indicates the ON head. For all immunostainings, DAPI (blue) was used as a nuclear counterstain. ONC, optic nerve crush; hpi, hours postinjury; dpi, days postinjury; NFL, nerve fiber layer; RGCL, retinal ganglion cell layer; IPL, inner plexiform layer; INL, inner nuclear layer; OPL, outer plexiform layer; ONL, outer nuclear layer; PRL, photoreceptor layer. Scale bars = 20 µm in C-G,K; 5 µm in H-J,L-N; 50 µm in O-P. |