
Fig. 1
- ID
- ZDB-FIG-160405-1
- Publication
- Vaithianathan et al., 2016 - Nanoscale dynamics of synaptic vesicle trafficking and fusion at the presynaptic active zone
- Other Figures
- All Figure Page
- Back to All Figure Page
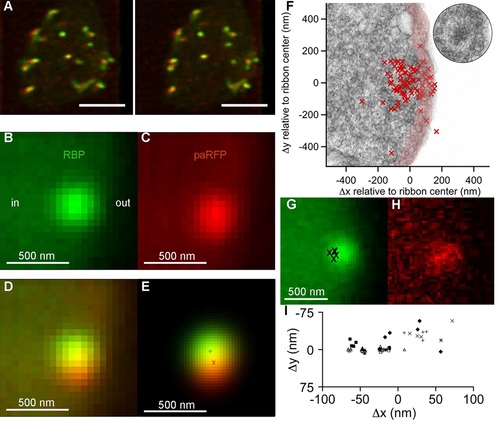
Synaptic vesicles labeled with Vglut1-paRFP stably associate with synaptic ribbons at the active zone.(A) Stereogram of a 3D reconstruction from a series of confocal optical sections through the synaptic terminal of a zebrafish BPC, showing photoactivated Vglut1-paRFP (red) near synaptic ribbons (green). A rotating view of the reconstruction is provided in Video 2. Scale bar = 2 µm. Details of recording and photoactivation are provided in Figure 1-figure supplement 1. (B) Close-up view of a synaptic ribbon labeled with green-fluorescent RBP, which also fills the cytoplasm. Outside of the cell is to the right, which is the standard orientation adopted for all images. Average of 16 frames. (C) View of the same region showing a single Vglut1-paRFP spot, averaged over 128 frames. (D) Superposition of images from B and C. (E) 2D Gaussians (Figure 1-figure supplement 2) fitted to RBP and paRFP fluorescence, with peaks marked by + and X respectively. (F) Positions of 81 paRFP spots (red Xs) relative to the center of the RBP-labeled ribbon, superimposed on an electron micrograph of a ribbon in a zebrafish BPC. The pink region depicts the ~100-nm region imaged in TIRFM experiments (except that the region would be planar in an actual TIRFM experiment). The inset reproduces the ribbon image without overlaid paRFP centroids. (G) Ribbon image with superimposed positions of a paRFP spot, shown by Xs, followed for 90 s without stimulation. Each position was determined by fitting a 2D Gaussian to a single averaged image of paRFP fluorescence like that shown in H. (H) An example of a single paRFP image, averaged over 10 frames, used to estimate paRFP positions shown in G. (I) Stability of paRFP location in the absence of stimulation for 10 experiments like that illustrated in G and H. Each symbol shows an individual paRFP location, and the different symbol types show results for a particular experiment. |