
Fig. 6
- ID
- ZDB-FIG-160401-4
- Publication
- Faure et al., 2016 - A workflow to process 3D+time microscopy images of developing organisms and reconstruct their cell lineage
- Other Figures
- All Figure Page
- Back to All Figure Page
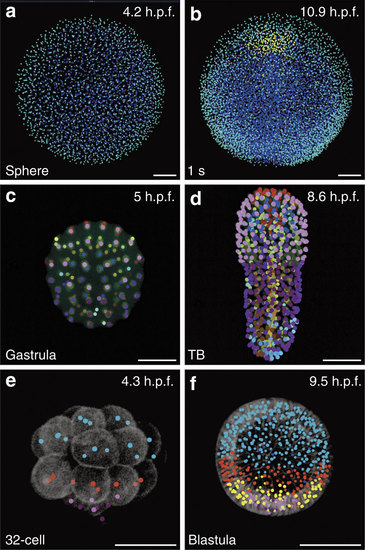
Automated fate map propagation. Cells were manually selected according to their identity or fate, using the interactive visualization tool Mov-IT. Developmental stages indicated bottom left, developmental times in h.p.f., top right. All scale bars, 50 µm. (a,b) Three cell populations in Danio rerio specimen Dr1, animal pole view; (a) sphere stage, ventral (anterior) up, enveloping layer cells in cyan, epiblast cells in blue; (b) 1-somite stage, same colour code plus hypoblast cells in yellow. (c,d) Fate map in Phallusia mammillata specimen Pm1, vegetal view, circum notochord up, colour code as in ref. 33; (c) gastrula stage; (d) tailbud (TB) stage with automated propagation along the cell lineage of the fate map shown in c. (e,f) Cell populations in Paracentrotus lividus specimen Pl1, lateral view, animal pole up; small micromeres in dark purple, large micromeres in light purple; mesomeres in cyan. (e) 32-cell stage, macromeres in red; (f) blastula stage, Veg1 cell population in red, Veg2 cell population in yellow. |