
Fig. 4
- ID
- ZDB-FIG-160321-33
- Publication
- Zheng et al., 2013 - Transcriptomic analyses of sexual dimorphism of the zebrafish liver and the effect of sex hormones
- Other Figures
- All Figure Page
- Back to All Figure Page
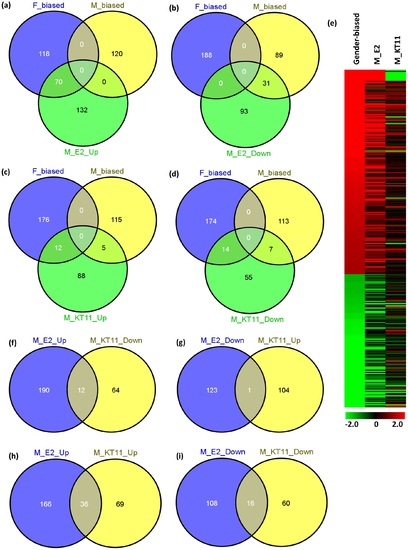
Intersections of differentially expressed genes in the male zebrafish livers after E2 or KT11 treatment with sex-biased genes. (a) Venn diagram of up-regulated genes in E2-treated males overlapped with sex-biased genes. (b) Venn diagram of down-regulated genes in E2-treated males overlapped with sex-biased genes. (c) Venn diagram of up-regulated genes in KT11-treated males overlapped with sex-biased genes. (d) Venn diagram of down-regulated genes in KT11-treated males overlapped with sex-biased genes . (e) Heat map of expression changes of sex-biased genes in E2- and KT11-treated male livers. For the column corresponding to the sex-biased transcripts, red represents female-biased genes and green represents male-biased genes. For the two columns corresponding to the E2- and KT11-treated male livers, red represents up-regulation and green represents down-regulation. The color intensity is calculated by logarithm-transformed (base 10) p-value. (f) Venn diagram of overlap of up-regulated genes in E2-treated male and down-regulated genes in KT11-treated males. (g) Venn diagram of overlap of down-regulated genes in E2-treated male and up-regulated genes in KT11-treated males. (h) Venn diagram of overlap of up-regulated genes in E2-treated male and up-regulated genes in KT11-treated males. (i) Venn diagram of overlap of down-regulated genes in E2-treated male and down-regulated genes in KT11-treated males. |