
Fig. 1
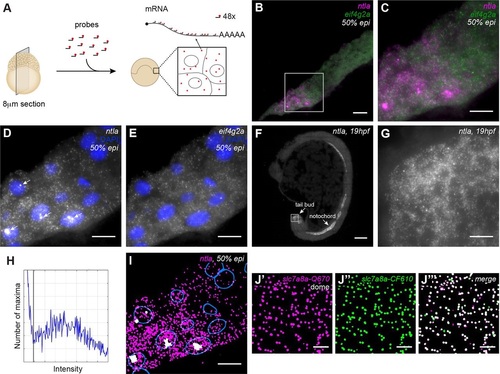
Sensitive and specific detection of transcripts and transcription foci in zebrafish sections with smFISH. (A) Overview of smFISH method on sections of zebrafish embryos. (B) smFISH for ntla and eif4g2a on a cryosection of a 50% epiboly stage embryo. Scale bar: 20µm. Complete animal cap in Fig. S1A. (C-E) Box in B at higher magnification. Scale bars: 10µm. (C) Dual-color smFISH for ntla (magenta) and eif4g2a (green). (D) smFISH for ntla. Arrows indicate transcription foci. (E) smFISH for eif4g2a. (F) smFISH for ntla on a 19hpf embryo. Scale bar: 100µm. (G) Detail of F, showing smFISH for ntla in the tail bud. Scale bar: 10µm. (H) Spot intensity plot for ntla smFISH on the complete animal cap shown in Fig. S1A. Black line indicates transcript detection threshold. (I) Detection of ntla transcripts (magenta) and foci (white) with the Transcript analysis plugin. Nuclear outlines are indicated in blue. Scale bar: 20µm. (J) Dual-color detection of slc7a8a with two non-overlapping, differently labeled probe sets. Scale bars: 5µm. (J′) smFISH slc7a8a-Quasar670. (J′′) smFISH slc7a8a-CalFluor610. (J′′′) Dual-color view of transcripts detected with the two non-overlapping probe sets in J′ and J′′. Images are maximum projections of 17 z-slices spaced by 0.3µm. |
| Genes: | |
|---|---|
| Fish: | |
| Anatomical Terms: | |
| Stage Range: | 50%-epiboly to 20-25 somites |