
Fig. 6
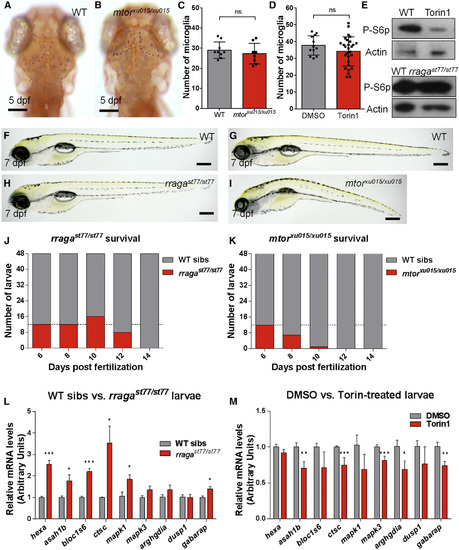
Distinct Phenotypes of mtorxu015/xu015 and rragast77/st77 Mutants (A and B) Images show living neutral red-stained WT (A) and mtor mutant (B) larvae at 5 dpf. Dorsal views, anterior to the top. (C and D) There was no significant reduction of the number of microglia at 5 dpf in mtor mutants or WT animals (C) treated with the mTOR inhibitor Torin1 (D). (E) Immunoblots of 5-dpf whole-animal protein lysates showing reduction of phospho-S6p levels after Torin1 treatment compared to control DMSO treatment. The level of phospho-S6p was similar in rragast77/st77 mutants and their WT siblings. Actin is shown as a loading control. (F–I) Lateral views of living larvae at 7 dpf show normal morphology of rragast77/st77 mutant (H) and abnormal morphology of mtorxu015/xu015 mutant (I), compared to their WT siblings (F and G, respectively). (J and K) Analysis of survival of rragast77/st77 (J) and mtorxu015/xu015 (K) mutants. Progeny of intercross of heterozygotes were raised, and 48 animals were genotyped by PCR for the mutant lesions at the indicated time points. Very few mtorxu015/xu015 mutants survived to 10 dpf, but most rragast77/st77 mutants survived to 12 dpf. For a homozygous viable mutation, 12 mutants would be expected at each time point on average (dotted lines). (L) qRT-PCR of whole-animal RNA samples at 5 dpf showed an increase in expression of some target genes of the lysosomal transcription factor TFEB in rragast77/st77 mutants relative to their WT siblings. (M) Similar qRT-PCR did not detect any increased expression of the genes analyzed in mtorxu015/xu015 mutants, and many were significantly reduced. Error bars show SEM of samples analyzed in triplicate. Statistical significance determined by a two-tailed t test (*p < 0.05, **p < 0.01, and ***p < 0.005). All scale bars, 50 µm. All larvae analyzed in (A)–(C) and (F)–(I) were genotyped by PCR. rragast77/st77 mutants analyzed in the immunoblot (E) were genotyped as described in the Experimental Procedures. rraga mutants analyzed by RT-PCR were identified by neutral red staining prior to RNA isolation. |
| Genes: | |
|---|---|
| Fish: | |
| Condition: | |
| Anatomical Term: | |
| Stage: | Day 5 |
| Fish: | |
|---|---|
| Condition: | |
| Observed In: | |
| Stage Range: | Day 5 to Days 7-13 |