
Fig. 4
- ID
- ZDB-FIG-160203-5
- Publication
- Zou et al., 2015 - An internal promoter underlies the difference in disease severity between N- and C-terminal truncation mutations of Titin
- Other Figures
- All Figure Page
- Back to All Figure Page
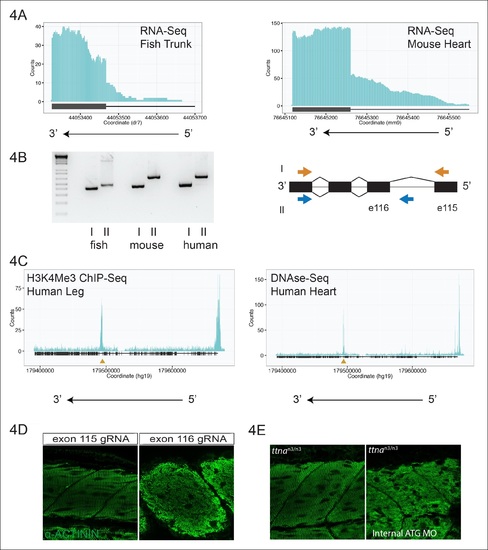
An internal promoter at the distal I-band explains phenotypic differences between N- an C-terminal ttna mutants. (A) RNA-Seq data from 72 hpf zebrafish trunk (left) and E12.5 mouse hearts (right) depicting accumulation of reads within the intron, upstream of the orthologous exons 116 (zebrafish) and 223 (mouse). The Ttn gene is on the negative strand and so reads within the upstream intron are shown to the right of the black bar, which indicates the position of the relevant exon. (B) Transcription from an alternative Titin promoter occurs in zebrafish, mouse, and human heart. (left) PCR amplification using a primer in the upstream exon or an internal primer at or near the internal TSS (as determined by 5′-RACE) as forward primer and a shared reverse primer was performed using cDNA from zebrafish, mouse and human heart. For all three species, products of the expected size were found, supporting transcription from an internal promoter. (right) Cartoon representation of PCR amplification scheme, with exon numbering according to zebrafish transcript. The zebrafish 5′ UTR is shorter than that of mouse and human. (C) (left) H3K4me3 ChIP-Seq data from human fetal leg muscle (GEO Accession GSM1058781), indicating an active promoter overlies exon 240, which is orthologous to exon 116 in zebrafish. The peak at the far right of the figure represents the conventional human TTN promoter. (right) DNAse-Seq data from human fetal heart (GEO Accession GSM665830) indicates highly accessible chromatin overlying exon 240, which typically demarcate enhancers or promoters (Neph et al., 2013). The accessible chromatin peak at the far right is the conventional TTN promoter. The gold triangle in both panels indicates the genomic position of the human internal promoter TSS identified through 5′-RACE. (D) Phenotypic divergence in skeletal myopathy in ttna truncations occurs at the exons flanking the alternative promoter. Cas9 protein and high dose gRNAs corresponding to exon 115 or exon 116 were injected into 1 cell embryos. At 72 hpf, embryos with complete or near complete cessation of cardiac contraction were collected and immunostained for α–actinin to assess skeletal muscle architecture. (E) An ATG morpholino targeting the intronic region upstream of the novel initiator methionine is sufficient to create skeletal muscle disarray on a ttnan3/n3 background. 1–2 cell embryos from a ttnan3/wt cross were injected with an intronic morpholino and ttnan3/n3 homozygotes immunostained for α–actinin to assess sarcomere architecture in the skeletal muscle. No skeletal muscle disarray was seen in wild-type fish injected with the internal ATG morpholino (data not shown). |
| Fish: | |
|---|---|
| Knockdown Reagents: | |
| Observed In: | |
| Stage: | Protruding-mouth |